Understanding the Seq Storage view
Seq 2021 introduced a fantastic new visualization of how Seq uses disk and memory resources, under Data > Storage:
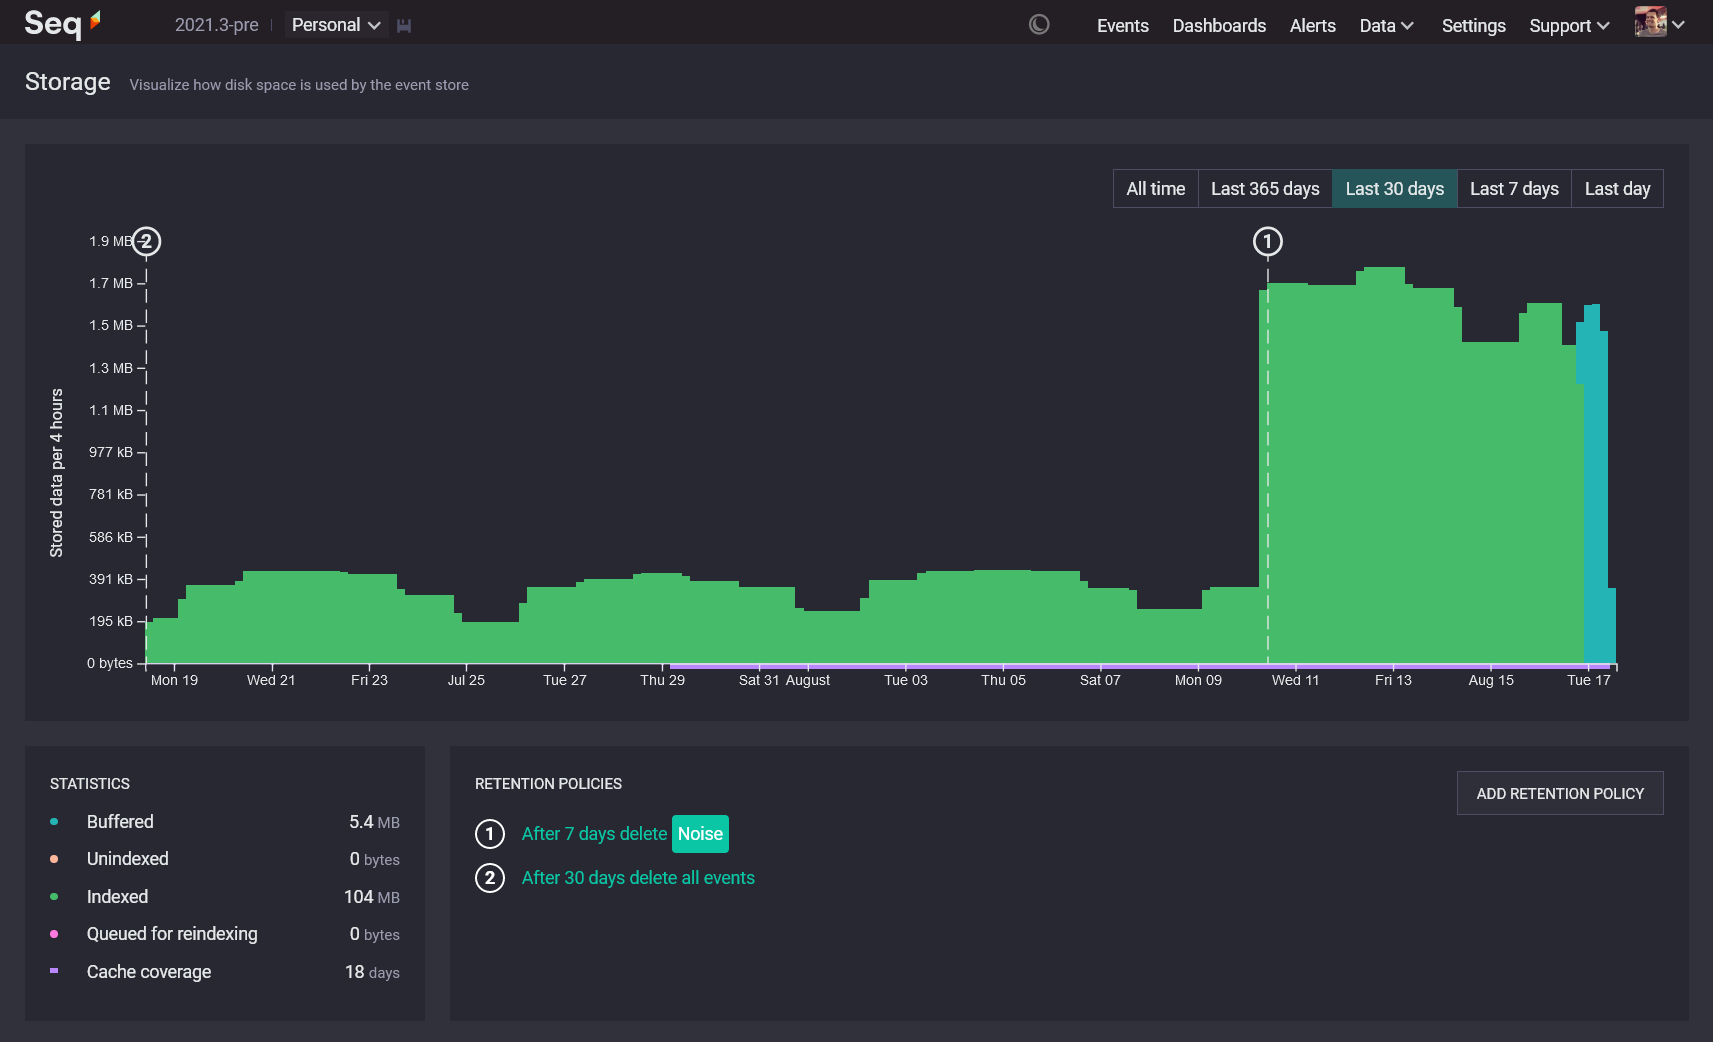
We created Storage because we we don't believe in the "store everything and sort it out later" philosophy of log centralization. This initially-intriguing idea leads down a path of waste, confusion, and expense. Seq's goal is to help teams store and use log data efficiently: when log volumes balloon out unexpectedly, we want to make this obvious and easy to trace, instead of sweeping it under the rug in the hopes of collecting ever-greater fees for ingestion, processing, and storage later on.
There are a few related pieces of information in this view; this post will help you interpret them to improve the performance and efficiency of your Seq installation.
Total stored data
The chart that takes up most of the Storage screen's real estate shows stored bytes on disk, sliced up by time intervals from the oldest events on the left, through to the newest over on the right.
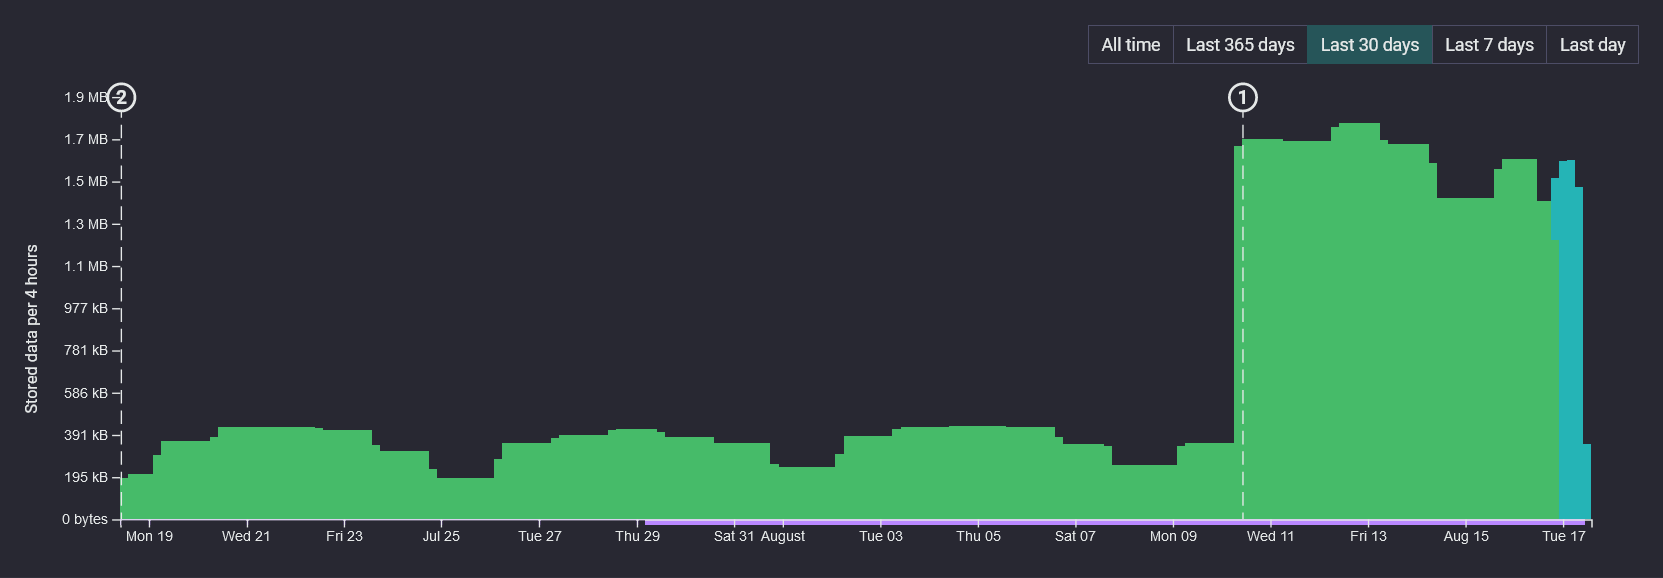
The height of each bar indicates how much data is stored for that time period. The measurement used here is actual bytes-on-disk, which are generally compressed. The actual amount of log data represented by each bar will be greater.
Does this add up to total disk consumption? Not precisely: Seq uses some additional disk space for temporary files and the snapshots that support multiversion concurrency control. During normal operation, the contribution these make to the storage footprint is negligible.
The chart breaks down stored data into four categories, that give you some insight into the workings of Seq's underlying event storage engine.
Buffered
If your server is ingesting data right now, you'll very likely see blue boxes over towards the right of the chart.
Buffered data is events in ingest buffers, which are five-minute chunks that events are written to as they arrive.
Ingest buffers are designed to be quick to write. Within a five minute window, the events are stored unsorted: events being generated "now" come from servers with slightly varying clocks, in batches of varying ages, over network links with varying latency. They'll generally land in the same five-minute bucket, but rarely in timestamp order.
Sorting events on disk, on arrival, consumes write bandwidth for little gain. Instead, Seq sorts ingest buffers on read, and uses various levels of caching to avoid having to read ingest buffers from disk at all.
Your most recent hour of data will almost always be stored in ingest buffers. Seq leaves those five minute buffers alone, if they've been written to in the past hour, to maximize the chance of collecting up stragglers before sorting, compacting, and indexing ingest buffers into long-term storage spans - a process called "coalescing".
Seq will also try to collect a decent amount of coalesceable data before processing ingest buffers (around 160 MB). If your server isn't ingesting much, it may take a long time to collect up enough to coalesce. Once an ingest buffer has been around a while - a couple of days, it and its neighbours will be coalesced into a span regardless of how much data they contain.
✅ If your Storage screen looks something like the screenshot, with blue only at the rightmost end of the chart, all is well!
🔔 If, however, blocks of blue appear farther back in time, interspersed with other types of data, you may have a clock synchronization issue that's timestamping events in the past or future.
🔔 If your storage screen is mostly blue, or has regions of blue covering more than a few days, something may be preventing coalescing from proceeding: insufficient disk space, a filesystem corruption, or some other problem could be at the root of this one.
Unindexed
When data is freshly coalesced from ingest buffers into spans, those spans won't have any associated indexes. These peachy-colored blocks of data are quite rare to see, because as long as all of the available coalescing work is done, Seq will move straight onto indexing.
✅ Occasionally spotting unindexed data is a normal part of Seq's operation. Nothing to worry about!
🔔 Seq prioritizes coalescing over indexing, so if limited time is available, data will be compacted and sorted, but signal indexing may be delayed. If you see peachy unindexed data hanging around for hours at time, check out hardware utilization, and consider whether your Seq machine may need more IO bandwidth or compute.
Indexed
Far and away the most common color to see on your Storage chart should be green. Green regions indicate data in span files, which have accompanying indexes for all current signals.
Indexed data is (often vastly) more efficient to query, when signals are used, because the indexes track - down to disk page resolution - which regions of the event stream contain events matching a signal's filters.
✅ You want to see a lot of green indexed data in this chart! If it's there, all you should need to pay attention to is how much of it is there.
🔔 Are there any outlying peaks, where a runaway process has filled your log server with junk? Clicking on a part of the chart will switch to the Events screen and show you what events are found in that time slice.
It's worth calling out that when you switch over to view the corresponding events, you won't get a breakdown by storage category: you'll see all of the events in that time slice, from buffers and spans, indexed and unindexed. Seq Support can help you to dig in deeper if you need to debug a storage problem.
Queued for reindexing
Imagine your server has 100 signals configured, including shared signals and the private ones created by each user. When fully indexed, each span in the event store will have 100 up-to-date entries.
Now a user changes one of the signals: all of a sudden, the spans have 99 up-to-date indexes, and no indexing information for the latest version of the changed signal. Spans in this state are shaded bright pink.
This change is instantaneous, so it's not unusual to see the whole chart flip from green to pink when a signal is modified. As indexing proceeds, spans will gradually flip back from unindexed/pink to indexed/green, as the indexer works its way through the event store.
✅ It's normal to see a lot of data queued for reindexing, and because the indexer only kicks in periodically, data can wait for 10 minutes or so before the indexer kicks off. As long as it's back to indexed/green in a short time, Seq's doing what it should.
🔔 Okay, so you've been watching the indexer work, and in fits and starts, it's only crawling through the data. Is the data being queued faster than it can be indexed, or the indexer taking so long that the stream is pink for hours at a time? You're very likely short on IO bandwidth or compute. Indexing will stick to a single core, so you'll need to check out CPU stats to know whether more CPUs (to handle other concurrent tasks) or faster CPUs are needed.
The x-axis
One last thing to take a quick look at is the x (time) axis of the storage chart.
🔔 Are the limits of the x axis what you'd expect? If you have stored data stretching far into the past or future, you may have data quality issues. Things can get quite strange - and queries slow - if your log sources have clock problems or application bugs that put timestamps back around the Unix epoch (1970) or worse, the .NET DateTime epoch (0001)!
Seq won't drop valid log events that arrive with odd timestamps; if you've inadvertedly ingested them, then setting a retention policy or issuing a manual delete to clean them up will be a good idea.
Tip: you can set per-API-key filters that compare incoming event timestamps with
now()and drop any dodgy ones. For example,@Timestamp >= now() - 7d or @Timestamp < now() + 1dwill only let events timestamped in the last week, or the next 24 hours, through to the event store.
Retention policies
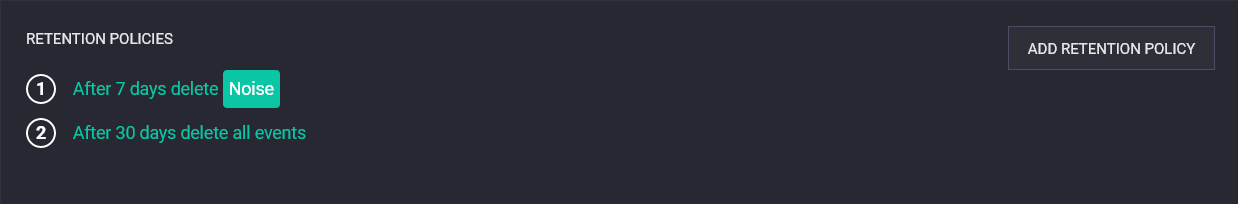
The little round, numbered markers on the chart show at which points Seq will apply retention policies to thin out data in the event stream. You can find the policy associated with each marker in the Retention Policies box, just below the chart.
Data that passes a retention policy marker isn't processed immediately: because the underlying span files are immutable, Seq will generally wait until an entire span becomes elegible for retention processing, before it kicks off and rewrites it in one single pass.
✅ You should see the volume of stored data for each interval drop significantly, shortly after it passes each retention policy marker. Policies that trim down the stream, like (1) in the screenshot, help Seq run more efficiently and produce query results faster.
🔔 No difference in stored volume at a marker? Retention processing has a cost, so unless it's for some worthy purpose, such as complying with data retention requirements, a policy that doesn't actually delete any worthwhile amount of data is just draining resources unnecessarily. Try to make the policy more aggressive, or remove it entirely.
RAM cache coverage
By this point, you know just about everything there is to know about how Seq manages disk storage! Seq goes to great lengths to make queries work well from disk, but there's no comparison between the performance of reading data from disk vs processing it in RAM.
That's the narrow purple line that runs under the x axis on the right-hand side of the chart. Data in this region is cached in RAM, yielding faster queries and better use of disk bandwidth.
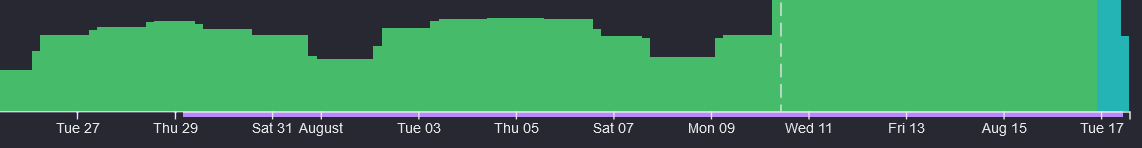
✅ Purple bar underlining all of the chart, or at least the last week? Great! Nothing much to do. You can still try moving retention policies to optimize caching (read on below), but you're probably experiencing good performance day-to-day.
🔔 No purple bar? Uh-oh. Whether your machine is vastly underresourced, another process is using too much memory, you're hitting a bug in Seq, or something else is going on entirely, you should contact the Seq Support team for some help. Working on a Seq instance without a decent amount of cache coverage is no fun at all.
🔔 Purple bar only covers a couple of days? It's pretty likely that your machine needs more memory, or some tuning of retention policies. Read on below!
Here's why we love the design of the Storage screen: it lets you directly visualize the impact of shortening or widening retention policies, on both disk space and the RAM cache.
If you're not getting enough of the event stream into RAM, you need to move one or more retention policies further into that purple cache window. Ideally, you'll have a retention policy right over close to the right-hand side, early in purple underlined area, that can drop out events that would otherwise take up RAM cache space.
Retention policies in the purple/cached area have the effect of making the purple area longer - even so much longer as to bring more retention policies into that purple area, for compounding benefit.
Another option, if your machine is bursting at the seams, is to filter more events out at the ingestion endpoint. Health checks, web logs for static file requests, and many other types of mundane, uninteresting events can be dropped during ingestion to save storage space. Seq's Ingestion screen, right next to Storate under the Data menu, can help you with this.
Getting help
Think you've found a problem with storage on your Seq server, or need more eyes on it to spot some opportunities for improvement? The Seq developers would love to hear from you, here or via support@datalust.co.
Happy logging!