Log data is pretty unruly stuff. As apps evolve it tends to grow in volume fairly quickly, and in the noise it can be hard to work out where application CPU overhead, network bandwidth, and storage space is actually going.
If you are using Seq with a structured logging library like Serilog or Microsoft.Extensions.Logging, grouping events by their event type is a quick-and-easy way to approximate which statements are responsible for generating the most data.
Here's a query to do just that:
select count(*) as count,
       sum(Length(@Document)) as total_chars,
       ToHexString(first(@EventType)) as type,
       first(@MessageTemplate) as template
from stream
group by @EventType
order by total_chars desc
limit 10
If you paste this into Seq's filter box you'll get a result set like:
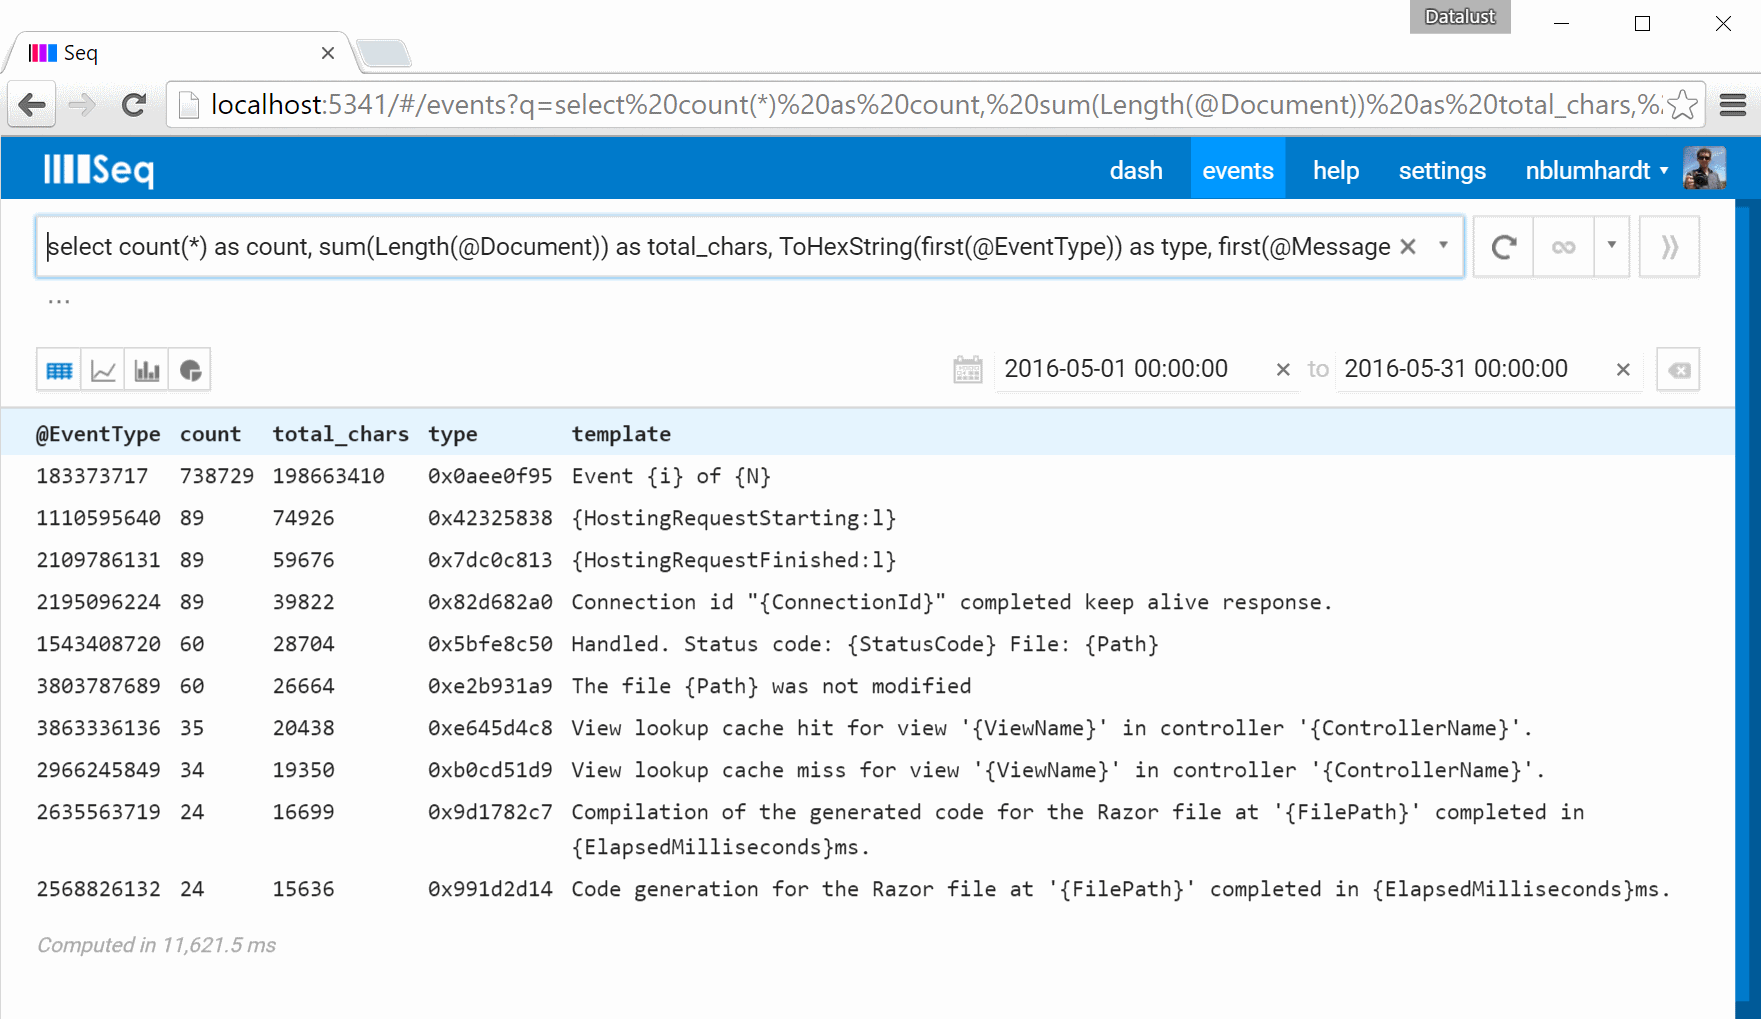
The query result shows the event type contributing the most raw JSON characters (total_chars) including its corresponding message template (template).
You can use the template field to search for the line of code that's responsible for generating the event: here it looks like:
Log.Information("Event {i} of {N}", i, total);
If one or two logging statements are responsible for a disproportionate amount of data, you might consider changing their level or redesigning them to send aggregate information instead of individual data items.
Tip: evaluating sum(Length(@Document)) is slow - Seq doesn't cache the original raw JSON document in memory and so the @Document property is a computed one. Run the query on a small date or time range for a start.
Seq records event types automatically for all log events with an associated message template. You can read a little more about event types in: