Structured Logging with NLog 4.5
It's here! Version 4.5 adds NLog to the list of industrial-strength logging libraries for .NET with full structured logging support.
NLog 4.5 is RTM! NLog 4.5 adds structured logging and .NET Standard support/UPW without breaking changes! 🎉🎉🎉https://t.co/1KlVYgG07G
— NLog .Net Logging (@NLogOfficial) March 25, 2018
I'm working on a news post and will update the API docs. See for now: https://t.co/Kjy2YwZIDP
How to use structured logging in the NLog documentation gives some good examples for getting started, but doesn't show off much of what you can do using structured logging. I'm taking on that task, here 😀.
What's structured logging all about?
It's a great time to be a software developer! Erm...., except when the software doesn't work as it should. Software runs the world, so bugs and outages can lead to painful real-world consequences. The more sophisticated the software, the harder (and more expensive) it can be to track down the cause of any given problem.
We've developed all kinds of weapons against misbehaving apps: static typing, automated testing, profilers, crash dumps, and monitoring systems - but application logs, which record the steps taken by an application as it executes, are still the richest source of data for postmortem diagnostics.
The problems with application logs all stem from their verbosity: any reasonably detailed trace of a running system will produce thousands, millions, or perhaps even billions of events per day. Finding and using the information in a log can be extremely time-consuming.
Recording application log events in plain text was the norm until very recently; plain text is friendly for humans to read and write in small amounts, but miserable to work with at larger volumes:
[2018-04-07T13:45:56.789Z INF] POST to https://example.com/api/order took 6729 ms
Easy to read! But given a thousand of these, which took longer than a second? What was the 99th percentile timing? Which API endpoint is responsible for the most latency? What's the distinct set of API endpoints being called? Digging this information out with regular expressions is even more tedious when the events you care about are interleaved with another million that you don't.
Modern structured logging uses a subtle and elegant twist to completely solve this problem.
Message templates: machine readable, but also human-friendly
The obvious solution to creating a queryable application log is to record events as JSON (or even, <shudder>, XML):
{
    "timestamp": "2018-04-07T13:45:56.789Z",
    "event": "api-call",
    "method": "POST",
    "endpoint": "https://example.com/api/order",
    "elapsed": 6729
}
Machine-readable JSON is easy for tools to work with, but unfortunately, even when it's nicely formatted it's not as quick to visually scan as plain text. Diagnostics can still involve reading a lot of events, so this ergonomic drawback is a serious one.
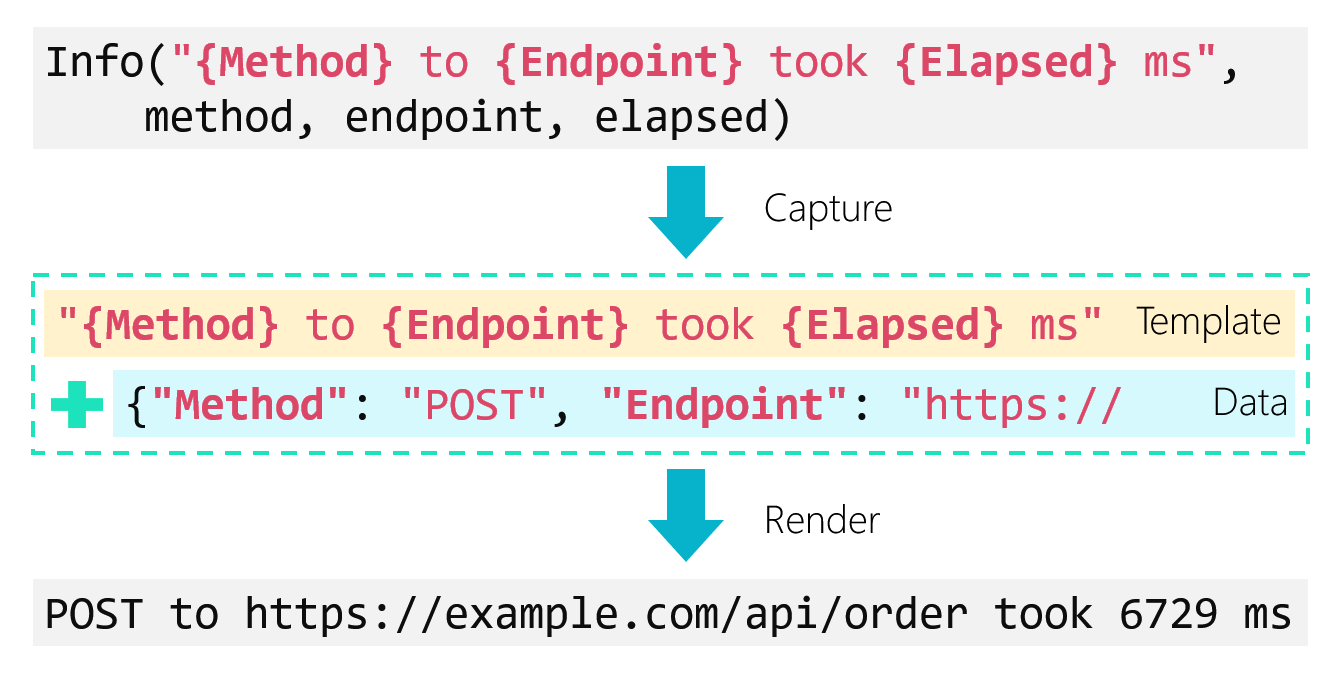
The twist in modern structured logging is to stay close to text, but to separate the capturing of log event data from rendering it. Here's how the event is recorded using NLog 4.5:
var endpoint = "https://example.com/api/order";
var method = "POST";
var elapsed = 6729;

logger.Info("{Method} to {Endpoint} took {Elapsed} ms", method, endpoint, elapsed);
Notice the named placeholders like {Method} and {Endpoint}? These are just like the {0} and {1} format string placeholders, but they associate a property name with the data that's inserted into the message in each location.
Internally, instead of formatting the event directly into text, NLog captures the template and a dictionary of property values. By substituting the property values into the template, a nice human-friendly log message can be rendered:
At the console, you won't see the difference between structured and text logging:
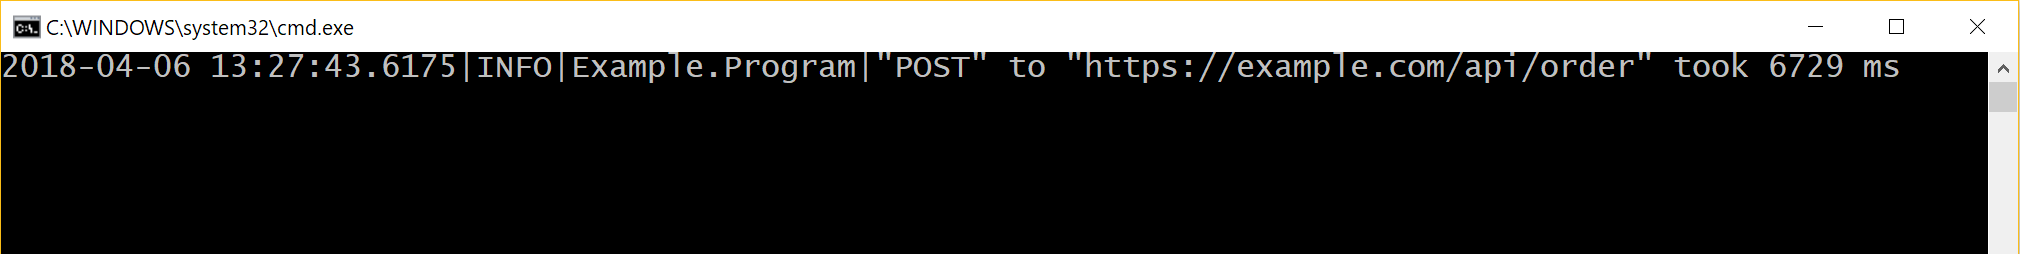
But that render step introduces a crucial capability: the event can be rendered into plain text, or, it can be rendered into JSON complete with the Method, Endpoint and Elapsed properties. We can even embed the friendly text version of the event into the JSON to get the best of both worlds.
Capturing structured event data with NLog 4.5 and Seq
In practice, structured logging doesn't usually mean swapping a text-formatted file for a JSON-formatted one. Instead, JSON-formatted events are sent to a central database or log server, which provides an interface to search and analyze them.
When I originally designed Seq, I was looking for the simplest possible way to collect and search structured log events. Seq has grown into a powerful and complete product, but you can still click through the Windows MSI and have it running locally on a development laptop in a few minutes, so it's a great way to get started if you're checking out structured logging for the first time.
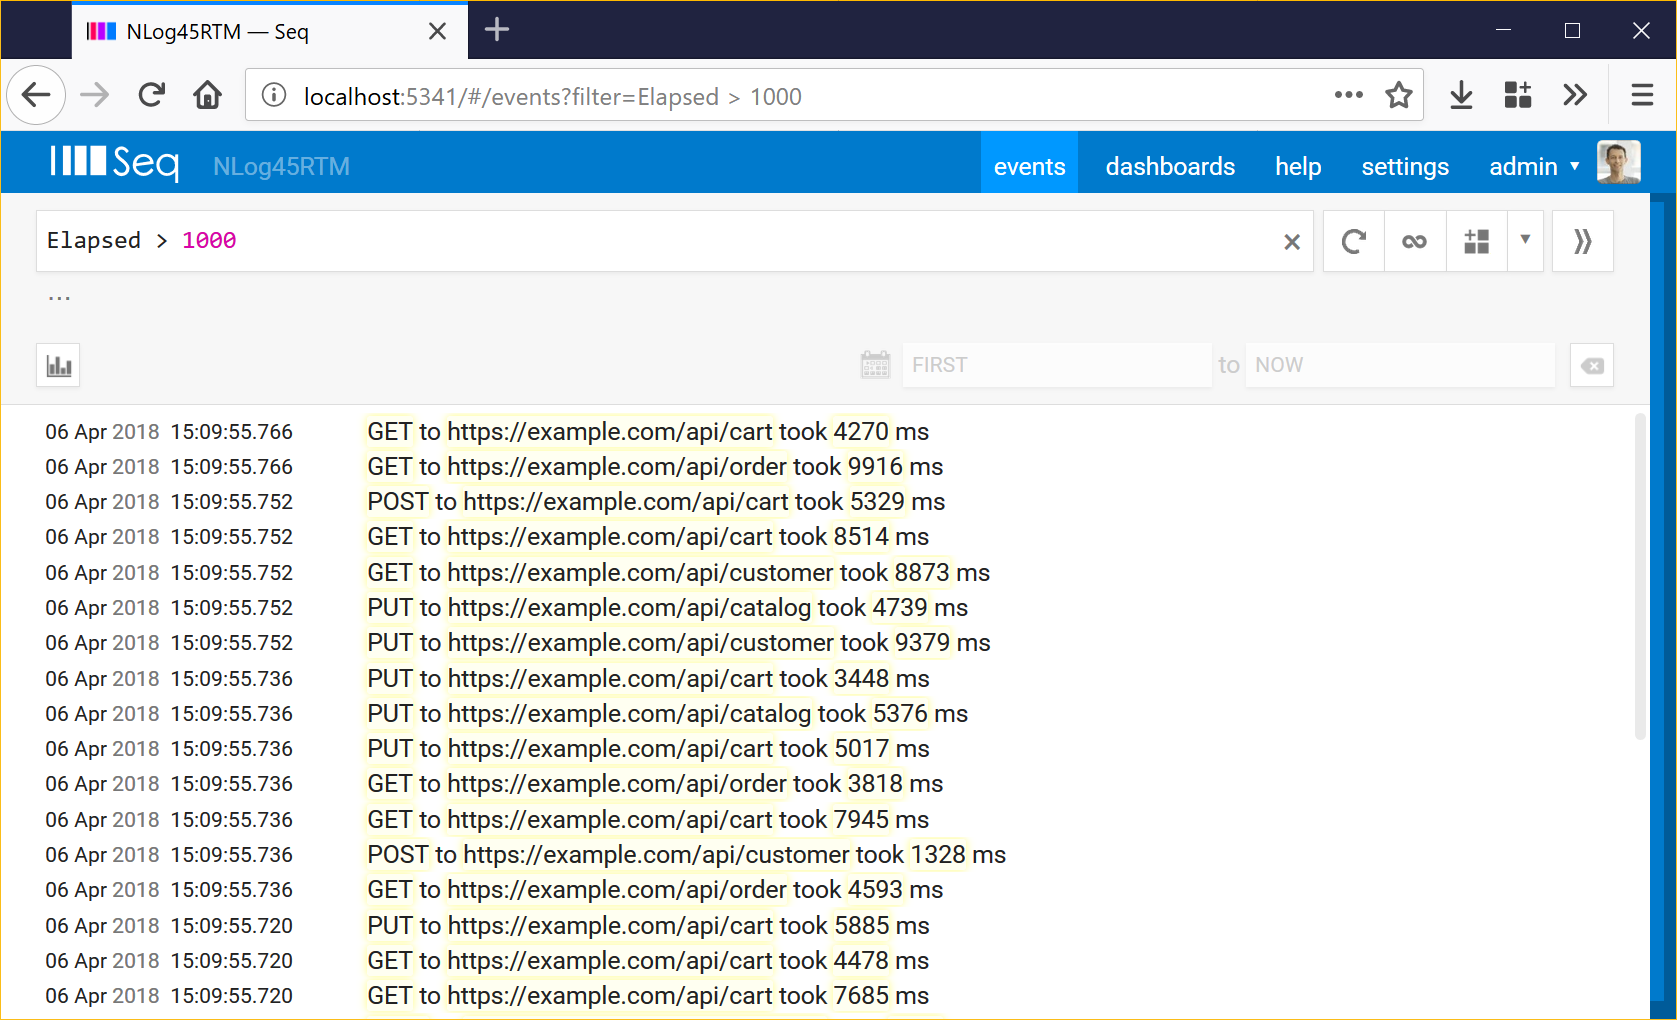
Finding API calls that took longer than a second is as simple as Elapsed > 1000. No parsing, no regular expressions - all the hard work is done by NLog when the event is captured using the message template.
NLog and the Seq target are distributed on NuGet. You'll need to install two packages to run the example:
Install-Package NLog
Install-Package NLog.Targets.Seq
NLog is config-driven; your NLog.config file needs some targets to tell NLog where to send events. So that we can see the plain text and structured versions of the events, we'll add both Seq and the console:
<?xml version="1.0" encoding="utf-8" ?>
<nlog xmlns="http://www.nlog-project.org/schemas/NLog.xsd"
      xmlns:xsi="http://www.w3.org/2001/XMLSchema-instance">
  <extensions>
    <add assembly="NLog.Targets.Seq"/>
  </extensions>
  <targets async="true">
    <target name="seq" xsi:type="Seq" serverUrl="http://localhost:5341" apiKey="">
      <property name="ThreadId" value="${threadid}" as="number" />
      <property name="MachineName" value="${machinename}" />
    </target>
    <target name="console" xsi:type="Console" />
  </targets>
  <rules>
    <logger name="*" minlevel="Info" writeTo="seq" />
    <logger name="*" minlevel="Info" writeTo="console" />
  </rules>
</nlog>
Breaking down some of what you see here:
<extensions>- theNLog.Targets.Seqassembly needs to be listed here so that NLog can find it<targets async="true">- using the async wrapper means logging will happen on a background thread, avoiding application pauses while events are written to Seq or the console<target name="Seq">- this adds the target, and is where a server URL and API key can be specified; you can leave it as above if you're running the default installation onlocalhost<property name="ThreadId">- NLog provides a whole range of interesting layout renderers like${threadid}and${machinename}- those can be globally attached to events by listing them here<rules>- setting up the targets alone isn't enough - rules tell NLog which events to send to each target
Finally, Program.cs:
using System;
using NLog;

namespace Example
{
    class Program
    {
        static readonly Logger Logger = LogManager.GetCurrentClassLogger();

        public static void Main()
        {
            var endpoint = "https://example.com/api/order";
            var method = "POST";
            var elapsed = 6729;

            logger.Info("{Method} to {Endpoint} took {Elapsed} ms", method, endpoint, elapsed);

            Console.ReadKey();
        }
    }
}
And that's it! Run the program and open a web browser on http://localhost:5341 and you should see some events, complete with fully-structured data:
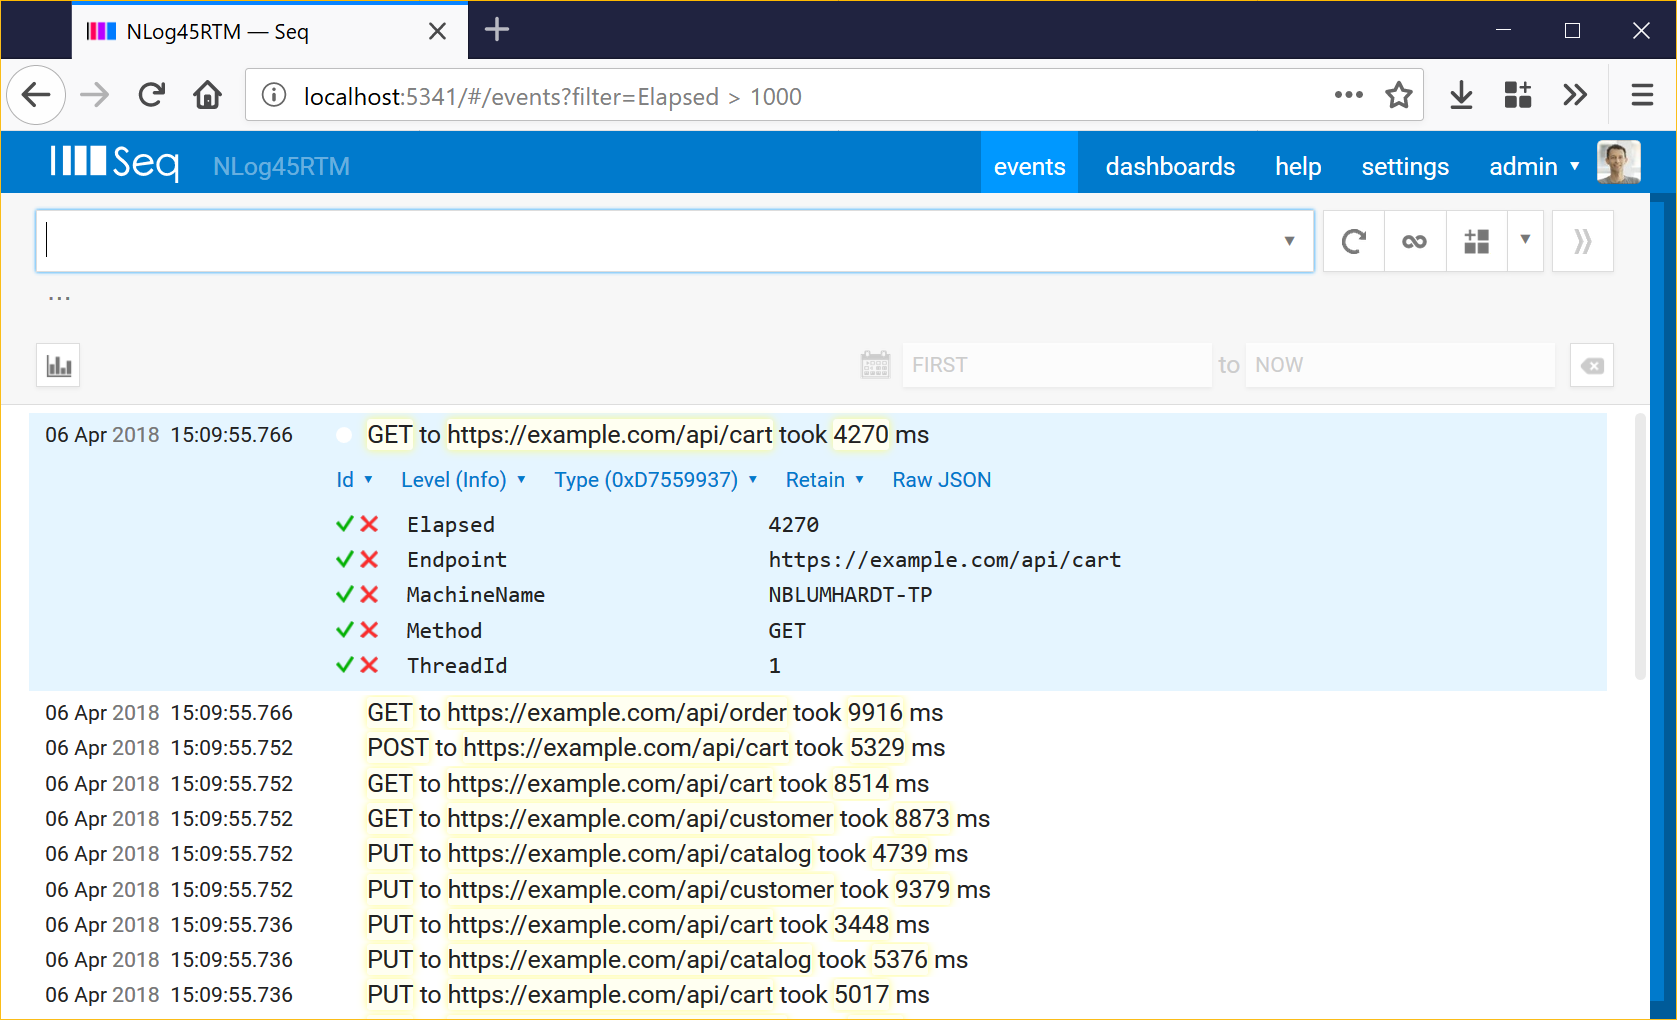
Clicking on an event will show the complete list of properties attached to the event. You can see both the global ThreadId and MachineName properties here, as well as the event-specific Method, Endpoint and Elapsed values.
Event types
If we modify the program to log a few different events, we'll see the next great benefit of structured logging:
Logger.Info("Hello from NLog!");
Logger.Info("Logged in as {Name}", Environment.UserName);
for (var i = 0; i < 10; ++i)
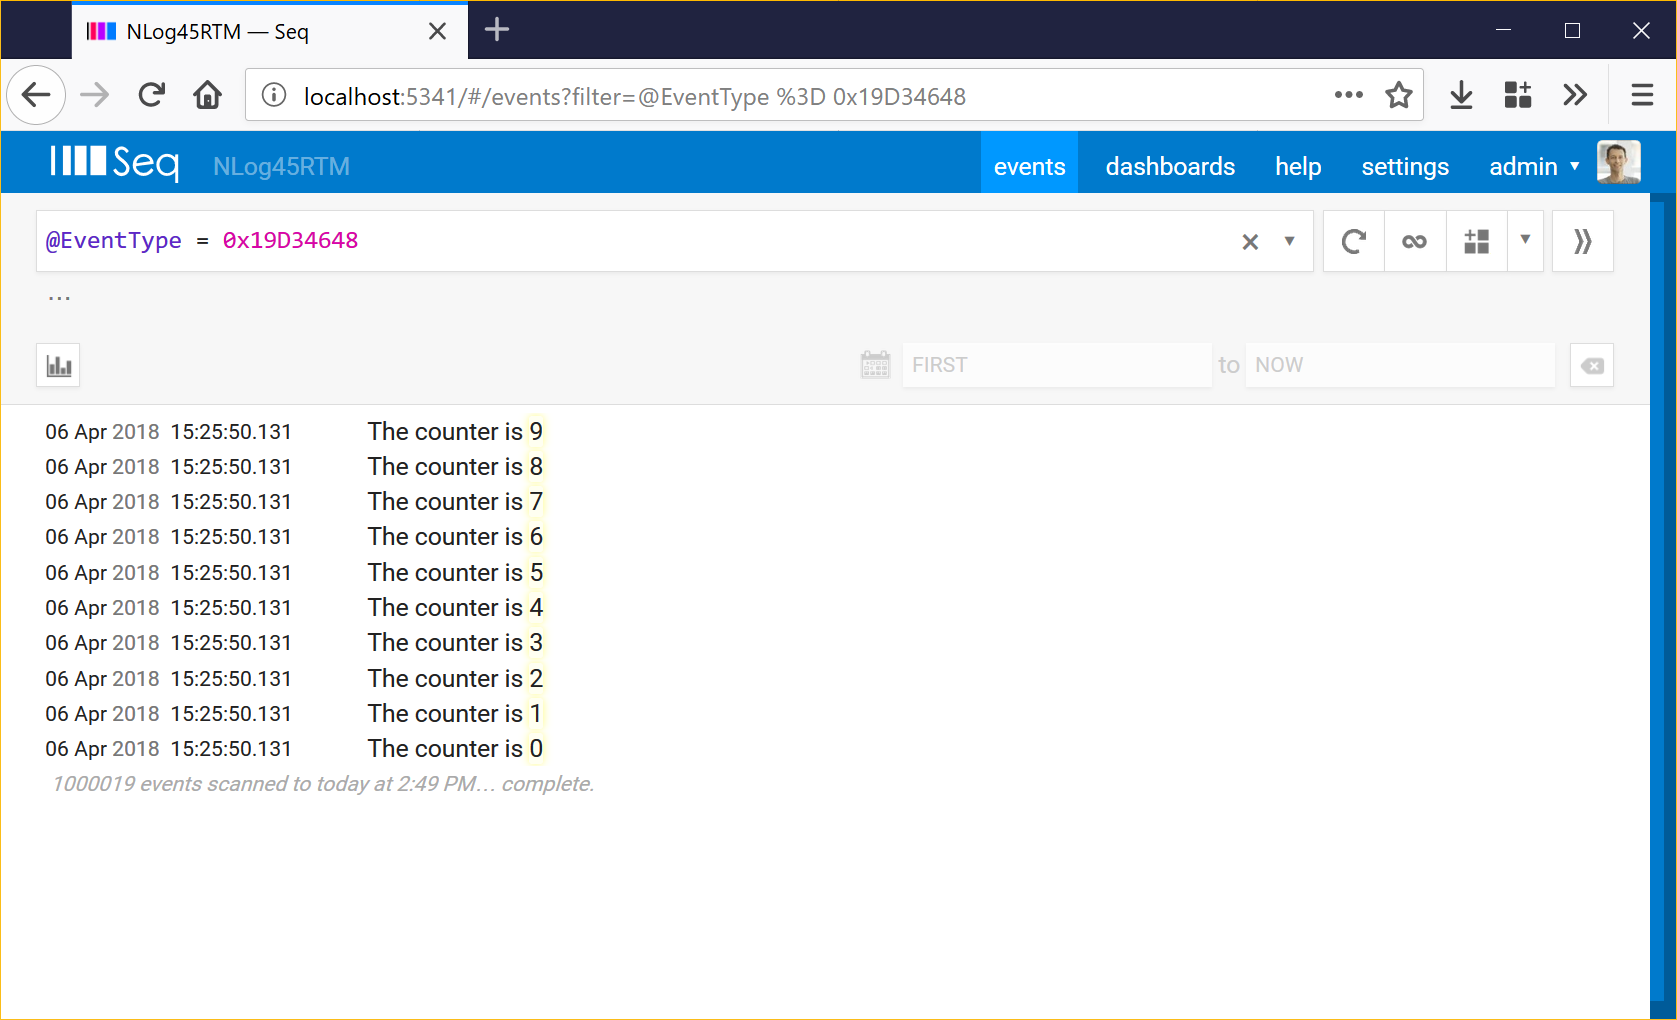
Logger.Info("The counter is {Counter}", i);
When we log ten events with counter values from 0 to 9, each event has a different textual rendering, but, they all share the same template: "The counter is {Counter}". Seq takes advantage of this to assign the events an event type derived from the template. By clicking an event, Type (0x19D34648), Find, we can see just the events raised from this particular logging statement:
Event types are incredibly powerful not only for finding events, but for excluding noisy ones. A typical log stream of a million events might be generated from only a few hundred event types: once you start excluding superfluous events, the more interesting ones quickly rise to the surface.
Some more complex queries to try
Now that we've collected some structured data ... well, what is the 99th percentile response time, anyway? Try:
select percentile(Elapsed, 99) as p99th
from stream
This will give you a single value. If you want to see the 99th percentile changing over time, add a time() grouping:
select percentile(Elapsed, 99) as p99th
from stream
group by time(1h)
Seq will show the data in a table by default. Click the little graph icon just above the result set to view it as a chart. The 1h here is a one hour duration - you might look at 5m five minute windows, 1d one day windows, and so on.
Another - what are the distinct API endpoints? That's:
select distinct(Endpoint) from stream
Finally, the endpoint with the highest average latency:
select mean(Elapsed) as latency
from stream
group by Endpoint
order by latency desc
limit 100
Easy? Once you can access and manipulate your log data without the painful intermediate parsing step, you'll be amazed how much it can tell you.
Finding out more
We've only touched the surface of what's possible with structured logging, NLog 4.5 and Seq. There's a lot more to find:
- in the NLog documentation,
- the Seq documentation,
- on the messagetemplates.org site, and
- on this blog.
Happy (structured) logging!