OpenTelemetry has emerged as an important standard for generating observability data. It provides a consistent model across all environments and reduces vendor lock-in. As such, we think it is important for Seq to support OpenTelemetry clients in addition to the other ingestion options that Seq provides.
2024.1 extends Seq's OpenTelemetry support to include traces as well as logs. Distributed tracing makes Seq even better for monitoring and troubleshooting the behavior and performance of complex distributed systems.
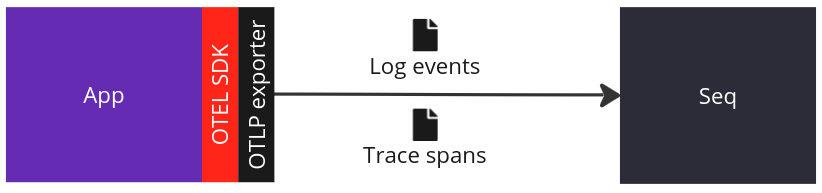
It is now possible to add the OpenTelemetry .NET SDK to a .NET application, configure an OpenTelemetry Protocol (OTLP) exporter, and send logs and traces directly to Seq.
Using the OpenTelemetry .NET SDK
To use the OpenTelemetry .NET SDK to send traces to Seq:
- Add the OpenTelemetry .NET SDK dependencies. Exactly which packages you need will depend upon your application.
- Choose any instrumentation libraries you would like to add. OpenTelemetry .NET includes instrumentation libraries for ASP.NET Core,
HttpClient, SQL clients and gRPC clients. The related project, opentelemetry-dotnet-contrib, includes many other instrumentation libraries. - Programmatically instrument your own code to record and send useful trace data.
Consult Seq's Tracing from OpenTelemetry .NET SDK documentation for more details and configuration options, as well as advice about how to make traces useful.
Generating Traces
The OpenTelemetry .NET SDK will automatically produce traces for any registered instrumentations. To manually generate spans use the StartActivity method on a registered ActivitySource:
using var activity = tracingSource.StartActivity("Hello {Name}");
activity?.SetTag("Name", "world");
Activities are given a name, which for Seq may include placeholders (like {Name}) for interpolating attached data. Key/value data can be attached using the SetTag method. After the activity is completed, its start and end timestamps are calculated, then the span is sent via the configured exporters.
If you prefer to start from a working example, try the OpenTelemetry .NET SDK to Seq example application.
AlwaysOnSampler.Analyzing Traces with Seq
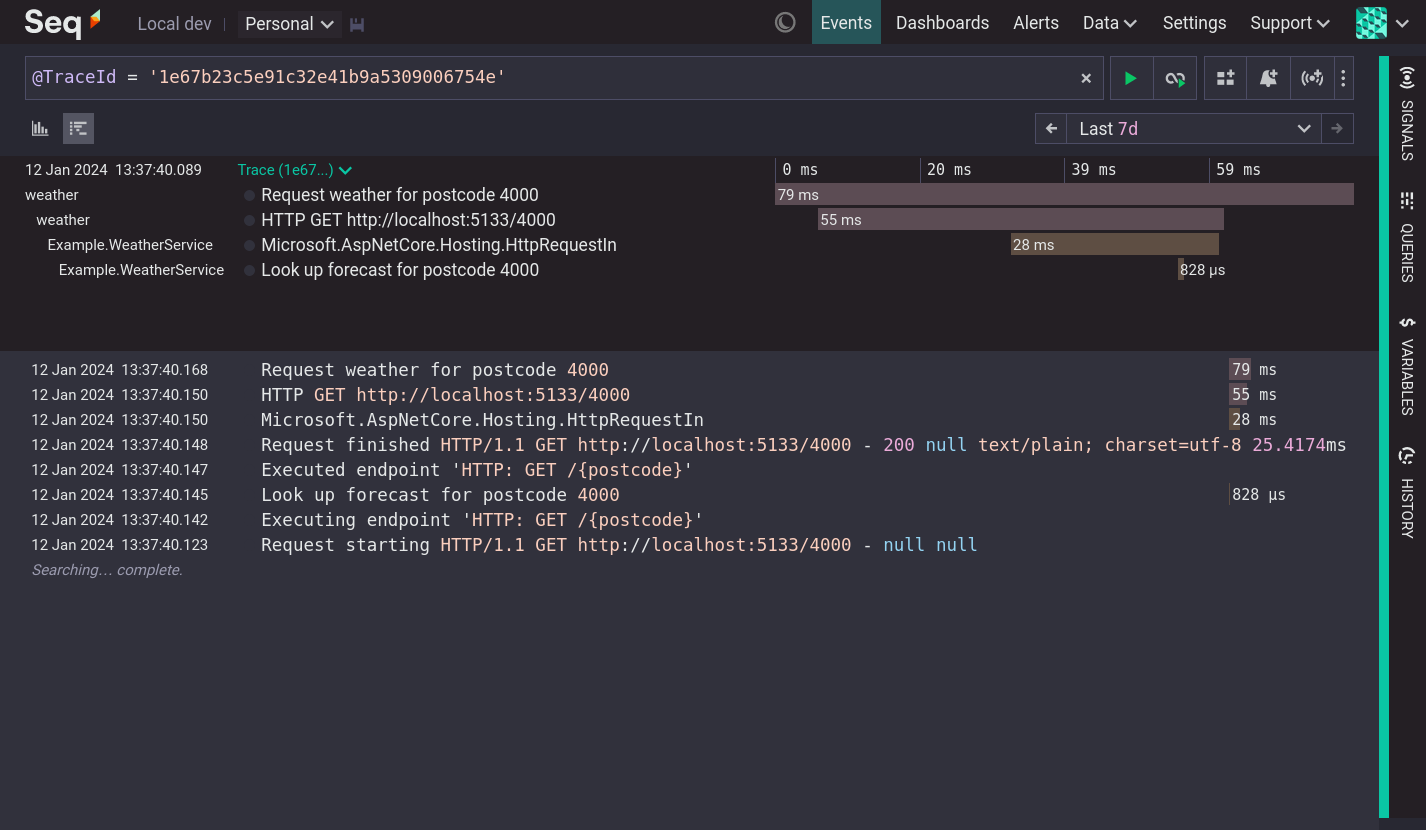
Seq fuses logs and traces into a single, coherent data stream. Everything you love about log analysis with Seq — easy search, full structured data support, message templates, analytic queries, dashboarding, alerting, and app integrations — now works seamlessly with trace data, too.
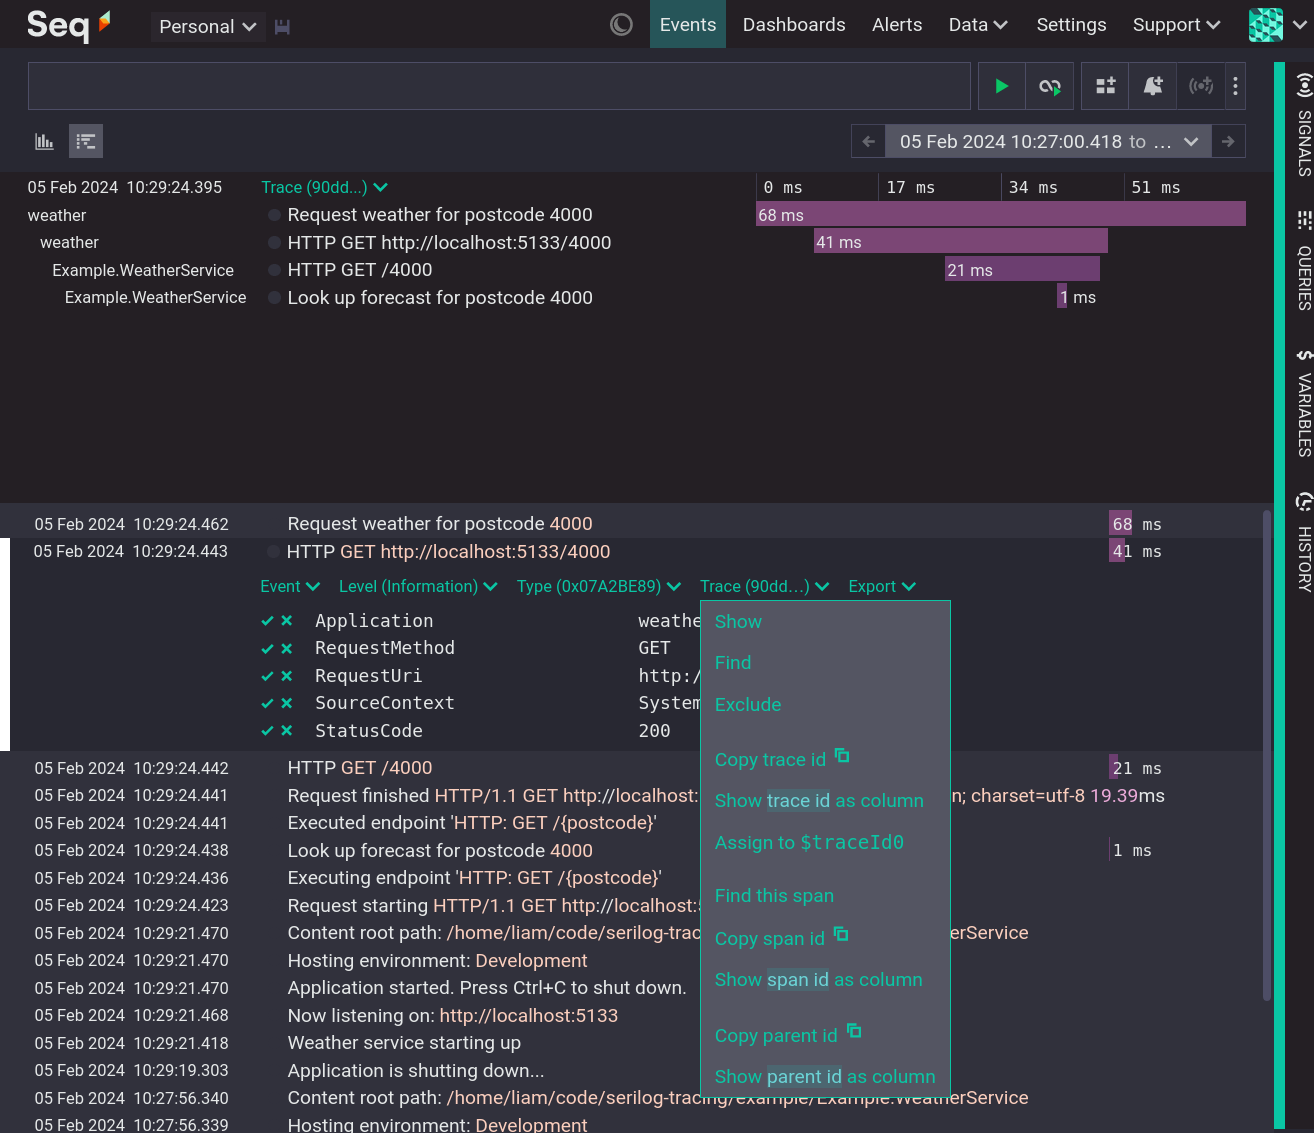
When viewed in Seq, events that represent spans have an additional Trace menu containing commands related to the analysis of traces, including displaying a visualization or searching for all the components of a trace.
See the Seq Tracing documentation for the full details of working with Traces in Seq.
Seq 2024.1 is just the beginning of tracing support in Seq. We'd love to hear your feedback and ideas over in the Seq discussion forum.