Seq 2024.1 RC is ready for you to try! 🎉
Seq-2024.1.*-preat downloads.datalust.codatalust/seq:previewon Docker Hubdatalust/seq:previewon AWS ECR
This release includes a lot of small UX improvements as well as the items listed in the release milestone on GitHub.
Distributed, hierarchical tracing support is the first thing to check out!
We've spent nearly a year updating Seq to not only visualize hierachical traces, but to support trace data throught the ingestion pipeline and event store, so that you can mix and match trace and log data:
- In search and analytic queries,
- On dashboards,
- In alerts,
- At integration points including plug-in input and output apps.
By deeply integrating traces and logs, Seq provides the most compelling aspects of tracing, while retaining all of the precise, flexible, low-level detail of structured logging.
We're updating Seq's documentation with a full guide to tracing with Seq, but the fundamentals are simple and you don't need to do very much to get up and running.
How do traces fit into Seq's data model?
Traces are collections of spans: there's no "trace" entity, only the spans linked by a common @TraceId. Spans themselves are events: they carry @Timestamp, @Level, @Message and @Exception just like log events, but add a handful of new properties, too.
@TraceId and @SpanId — these properties are optional for log events, but they're mandatory for spans. Each span has a unique @SpanId, and it's collected into a trace alongside spans with the same @TraceId.
@Start and @Elapsed — spans represent a computation or activity with a duration. The activity start time is captured in @Start, and the end time is @Timestamp (i.e. when the span is recorded). The convenient @Elapsed property is (@Timestamp - @Start), in Seq's native 100 nanosecond tick resolution, making filters like @Elapsed > 500ms possible.
@ParentId — if a span is the child of another span, then it will carry its parent span's id in @ParentId.
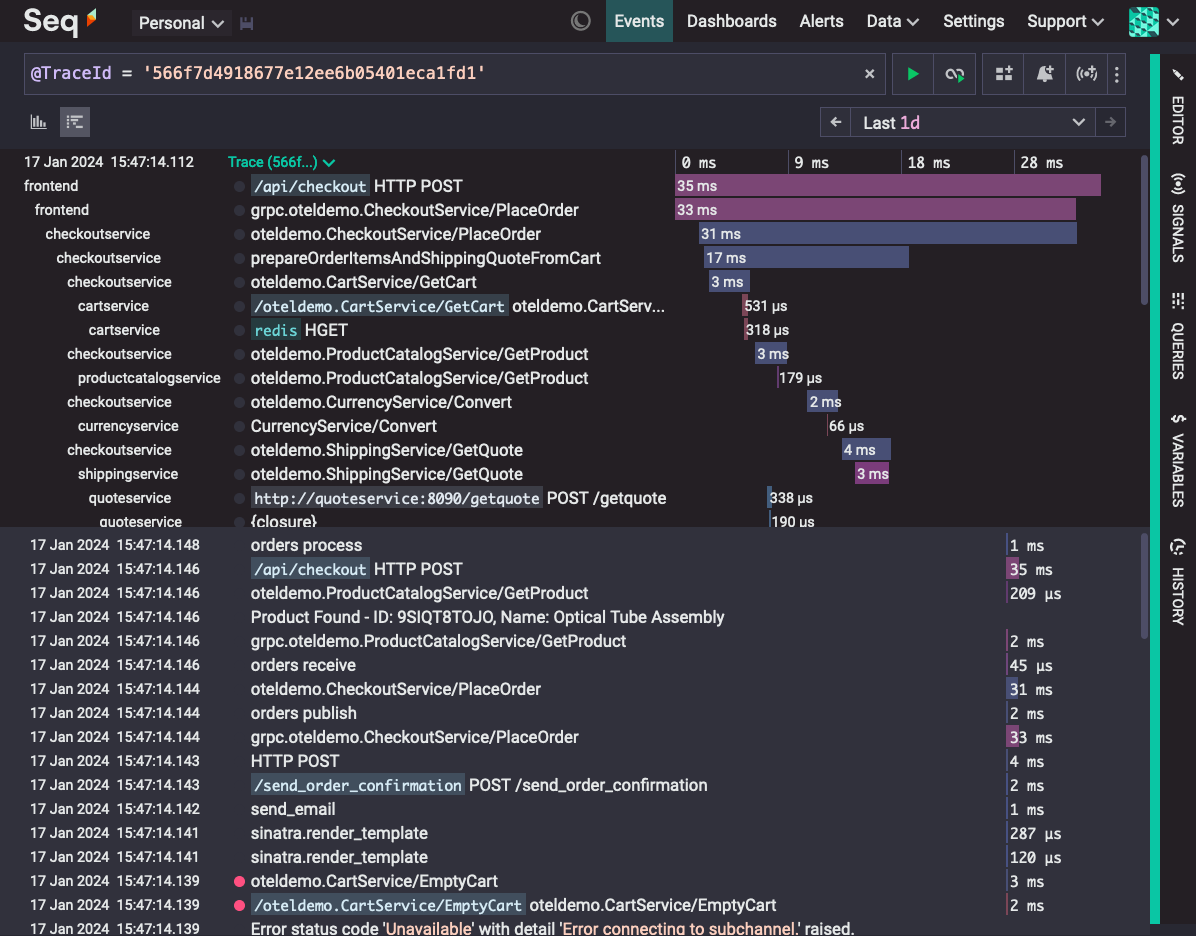
In search results, you can distinguish between spans and regular log events by the presence of a short timing bar to the right of the span name: spans have these, log events don't:

The timing bars use logarithmic scales so that you can quickly spot longer spans.
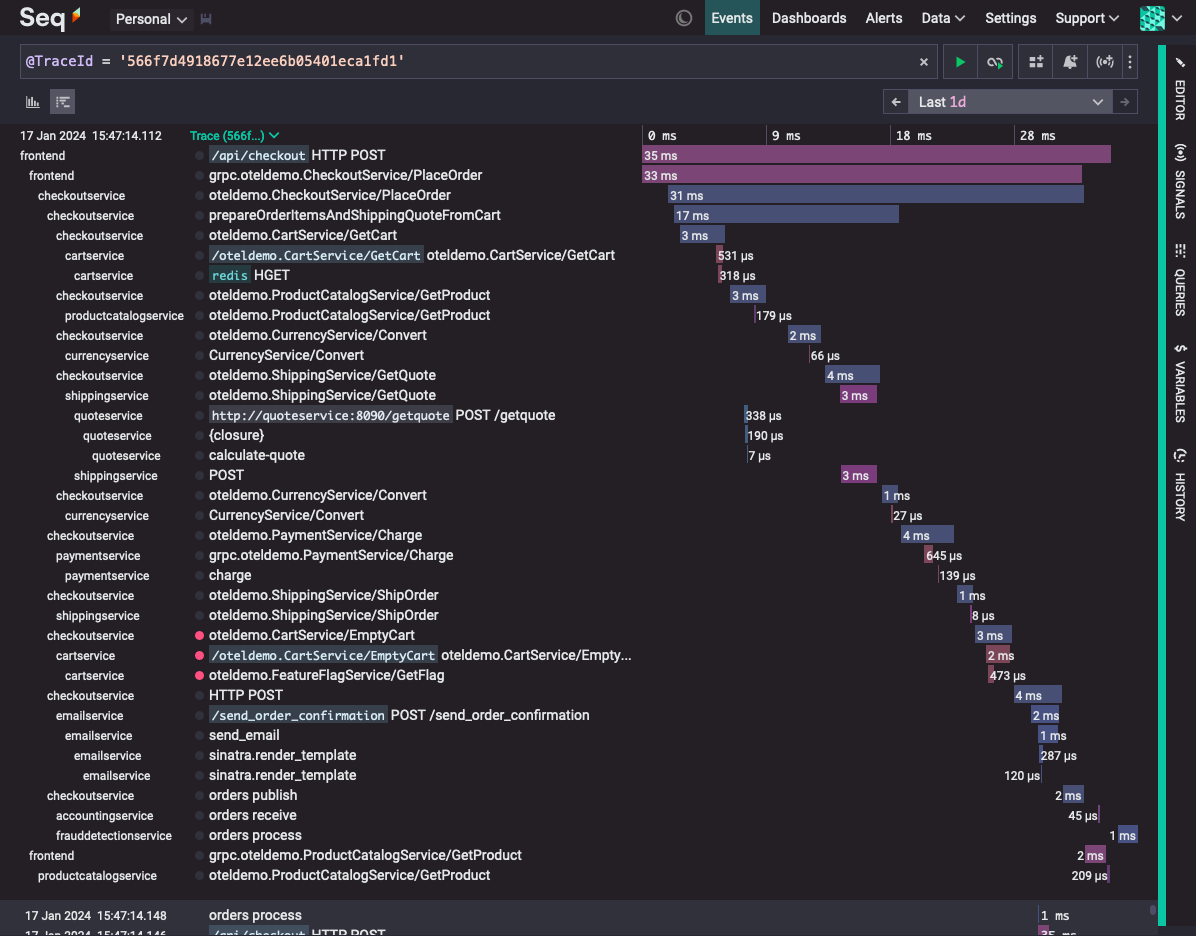
Clicking on a span timing bar will bring up the trace view:
The trace view lays out spans according to their parent-child relationships, and shows their durations and overlap on a timeline.
Finally, clicking on a span in the trace view will show options for searching within that span.
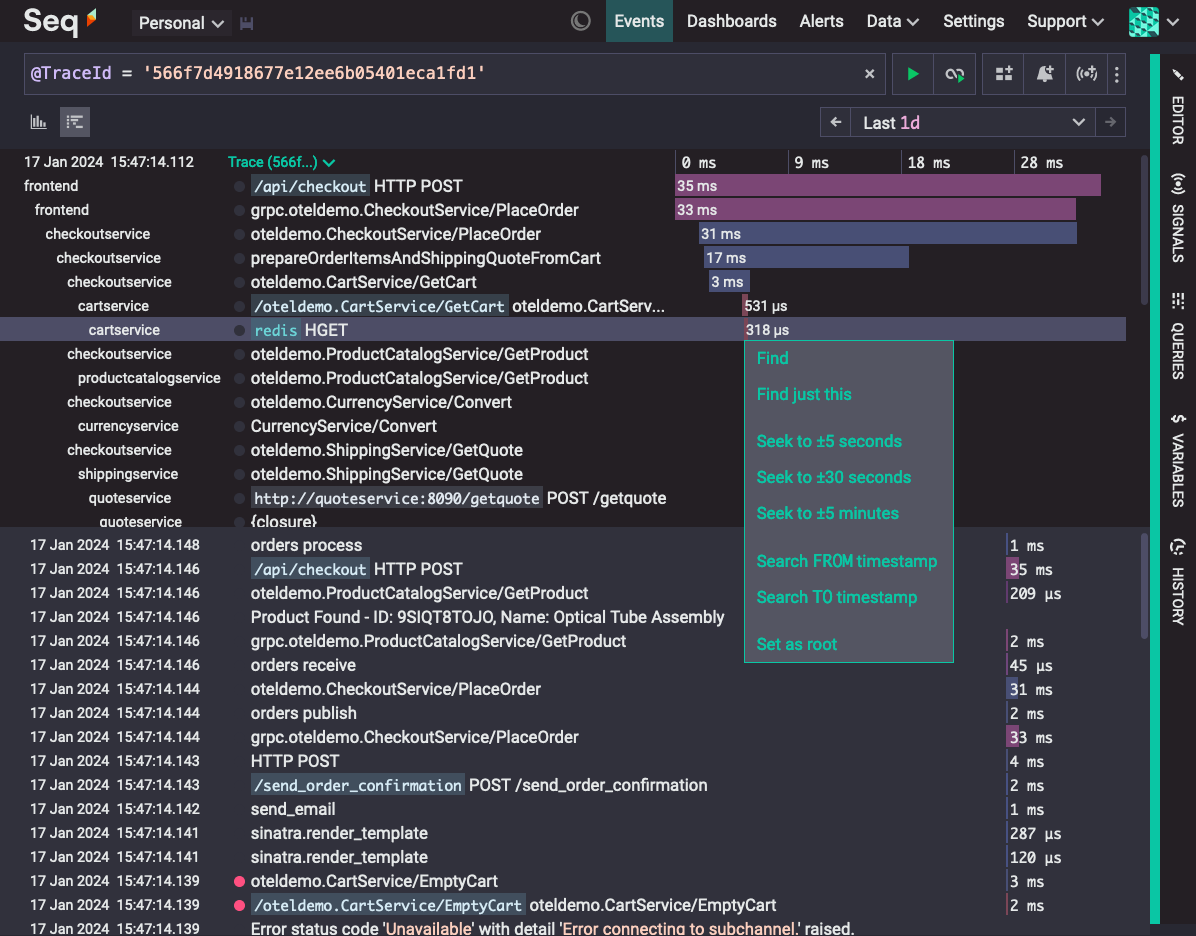
The Find menu item will search for the span itself and any log events that were tagged with the same @SpanId.
How do traces get from my app to Seq?
There are currently two ways to get traces into Seq. Both are supported natively in Seq itself, so the right choice will depend on your application and environment.
OpenTelemetry Protocol and SDKs
Seq supports the http/protobuf and gRPC flavors of the OpenTelemetry Protocol, for both logs and traces. The http/protobuf option is the easiest to get started with, but check out the docs for gRPC ingestion if you prefer that variant.
The http/protobuf ingestion endpoint for traces is /ingest/otlp/v1/traces, and this sits alongside the /ingest/otlp/v1/logs endpoint for logs. It's important to send the right data to the right endpoint - traces to the traces endpoint, and logs to the logs endpoint - or nothing will work correctly 🙂.
These paths recognised on any port Seq is serving: for example if you can reach the UI at https://seq.example.com, then https://seq.example.com/ingest/otlp/v1/traces will accept OTLP trace data. Similarly, if you're logging to http://localhost:5341, then http://localhost:5341/ingest/otlp/v1/traces will work, too.
Here's how to set up logs and tracing together, for Seq running at http://localhost:5341, using ASP.NET Core and the .NET OpenTelemetry SDK.
You'll need to dotnet new web, if you haven't already, then install some packages:
dotnet add package OpenTelemetry.Exporter.Console
dotnet add package OpenTelemetry.Exporter.OpenTelemetryProtocol
dotnet add package OpenTelemetry.Extensions.Hosting
dotnet add package OpenTelemetry.Instrumentation.AspNetCore
In Program.cs:
using OpenTelemetry.Exporter;
using OpenTelemetry.Logs;
using OpenTelemetry.Resources;
using OpenTelemetry.Trace;

var builder = WebApplication.CreateBuilder(args);

builder.Services.AddOpenTelemetry()
    .ConfigureResource(resource => resource.AddService(serviceName: builder.Environment.ApplicationName))
    .WithTracing(tracing =>
    {
        tracing.AddAspNetCoreInstrumentation();
        tracing.AddConsoleExporter();
        tracing.AddOtlpExporter(opt =>
        {
            opt.Endpoint = new Uri("http://localhost:5341/ingest/otlp/v1/traces");
            opt.Protocol = OtlpExportProtocol.HttpProtobuf;
            //opt.Headers = "X-Seq-ApiKey=abcde12345";
        });
    });

builder.Services.AddLogging(logging => logging.AddOpenTelemetry(openTelemetryLoggerOptions =>
{
    openTelemetryLoggerOptions.SetResourceBuilder(
        ResourceBuilder.CreateEmpty()
            .AddService(serviceName: builder.Environment.ApplicationName));

    // Some important options to improve data quality
    openTelemetryLoggerOptions.IncludeScopes = true;
   // openTelemetryLoggerOptions.IncludeFormattedMessage = true;

    openTelemetryLoggerOptions.AddConsoleExporter();
    openTelemetryLoggerOptions.AddOtlpExporter(opt =>
    {
        opt.Endpoint = new Uri("http://localhost:5341/ingest/otlp/v1/logs");
        opt.Protocol = OtlpExportProtocol.HttpProtobuf;
        //opt.Headers = "X-Seq-ApiKey=abcde12345";
    });
}));

var app = builder.Build();

app.MapGet("/", () => "Hello World!");

app.Logger.LogInformation("Starting {App}", builder.Environment.ApplicationName);
app.Run();
Tip: If the traces sent to Seq look a little opaque, use the green tick next to interesting span properties, and choose "Show as column" to include them in the trace view.
SerilogTracing
SerilogTracing is a lightweight tracing extension for Serilog that's being developed by the Datalust engineering team.
It integrates Serilog with .NET's built-in tracing infrastructure, provides an API for creating traces and spans, and includes tracing-aware Serilog sinks for OTLP, Seq, and Zipkin.
To get started with SerilogTracing and Seq 2024.1 RC in a new .NET application, you'll need to install a few NuGet packages:
dotnet add package Serilog;
dotnet add package SerilogTracing --prerelease
dotnet add package SerilogTracing.Sinks.Seq --prerelease
Add WriteTo.SeqTracing() to your LoggerConfiguration:
using Serilog;
using SerilogTracing;
using SerilogTracing.Sinks.Seq;

Log.Logger = new LoggerConfiguration()
    .Enrich.WithProperty("Application", "Example")
    .WriteTo.SeqTracing("http://localhost:5341")
    .CreateLogger();
And enable SerilogTracing's activity listener:
using var _ = new TracingConfiguration()
    .EnableTracing();
To create spans, use the StartActivity() extension method on ILogger:
using var activity = Log.Logger.StartActivity("Request weather for postcode {Postcode}", postcode);
// Activity will record timings when disposed.
Nested activities will be arranged into a trace, and the current trace propagated over HTTP requests through HttpClient.
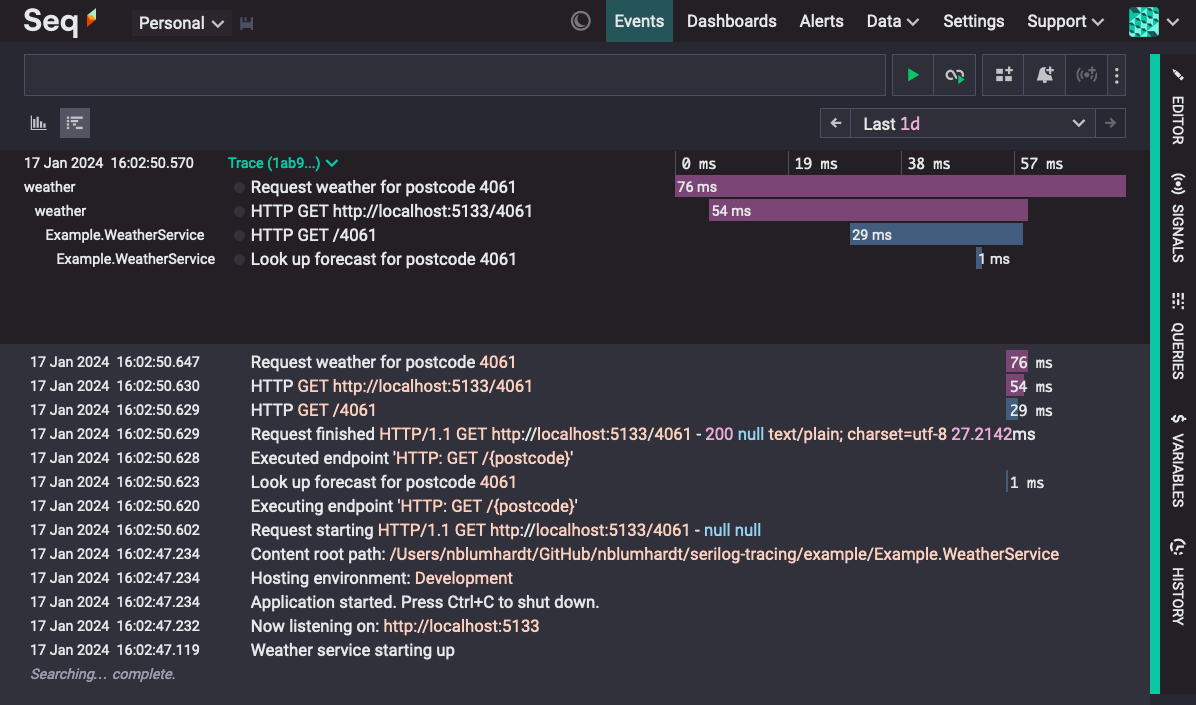
These snippets are from a more extensive example in the SerilogTracing repository.
Upgrading
We think the RC is in good shape! We don't expect to find significant bugs in core functionality, and early adopters have been using it successfully for a while now.
The major caveats that come with the RC are:
- After upgrading, new indexes will be created in a format that's incompatible with earlir Seq versions. There's a ten minute window to downgrade smoothly back to 2023.4, before you'll need to take additional manual steps to downgrade.
- Dotted property names that arrive via OTLP will now be unflattened into structured objects:
service.nameis ingested as an objectservicewith anameproperty by 2024.1, while earlier versions ingested this as a string'service.name'property. This change doesn't apply to other ingestion protocols - it's a change to OTLP only. - Traces can be large. Don't accidentally double or triple your ingested data volume by turning on tracing in production without checking what's going to be sent in a non-critical environment 😅.
- OpenTelemetry trace sources are many and varied; as more SDKs, apps, and languages are integrated there's a chance we'll find inconsistencies and feature gaps. Let us know about these, we're eager to smooth off any rough edges you might find!
If you're running a heavily-loaded production system and want to try the RC, consider dropping support@datalust.co a line to talk through the process and check out any potential capacity bottlenecks first.
Tracing is backed by a new index type, making searches for and within traces very fast, but you'll need to wait for indexing to complete (see Data > Storage) for this to take effect.