TL;DR: A new Seq 3.0 preview build is available. This one rounds out the syntax of Seq 3.0's most interesting feature, SQL Queries.
Why SQL Queries over Log Events?
Seq really draws attention to how much valuable information structured logs can reveal. Ever since Seq was released, customers have come to us with questions like "how can I find out how many times this event occurred?", or, "how can I get the list of unique values for this property?"
It took quite a while before a clear picture of how to handle this emerged. Many of us use SQL every day to answer these kinds of questions, so it's a natural fit for this task. Sticking as closely as possible to an established query language makes it much easier to get started than if we'd invented yet another query language or API of our own.
By implementing SQL, Seq isn't out to compete with traditional databases in any way, nor is it aiming to replace dedicated timeseries databases for heavy-duty metrics workloads. SQL in Seq is about answering more questions from log data, to make it easier to debug applications and uncover system behavior.
What level of maturity is the preview at? Seq 3.0 is still under development. SQL queries are fully-functional, though you'll find deviations from standard SQL, and omissions here and there. No performance work has been done yet, so some operations might take longer than intuitively expected. Server-side limits and timeouts are mostly unimplemented, so it's possible to create a very big result set, or very long-running query: keeping an eye on the date range for which the query is run is a good mitigation in most cases, however.
A Quick Tour
We use Seq when developing Seq :-) ... of course! You should be collecting and viewing logs in development too, since it's the only way to be sure that the right information will be there when you need it.
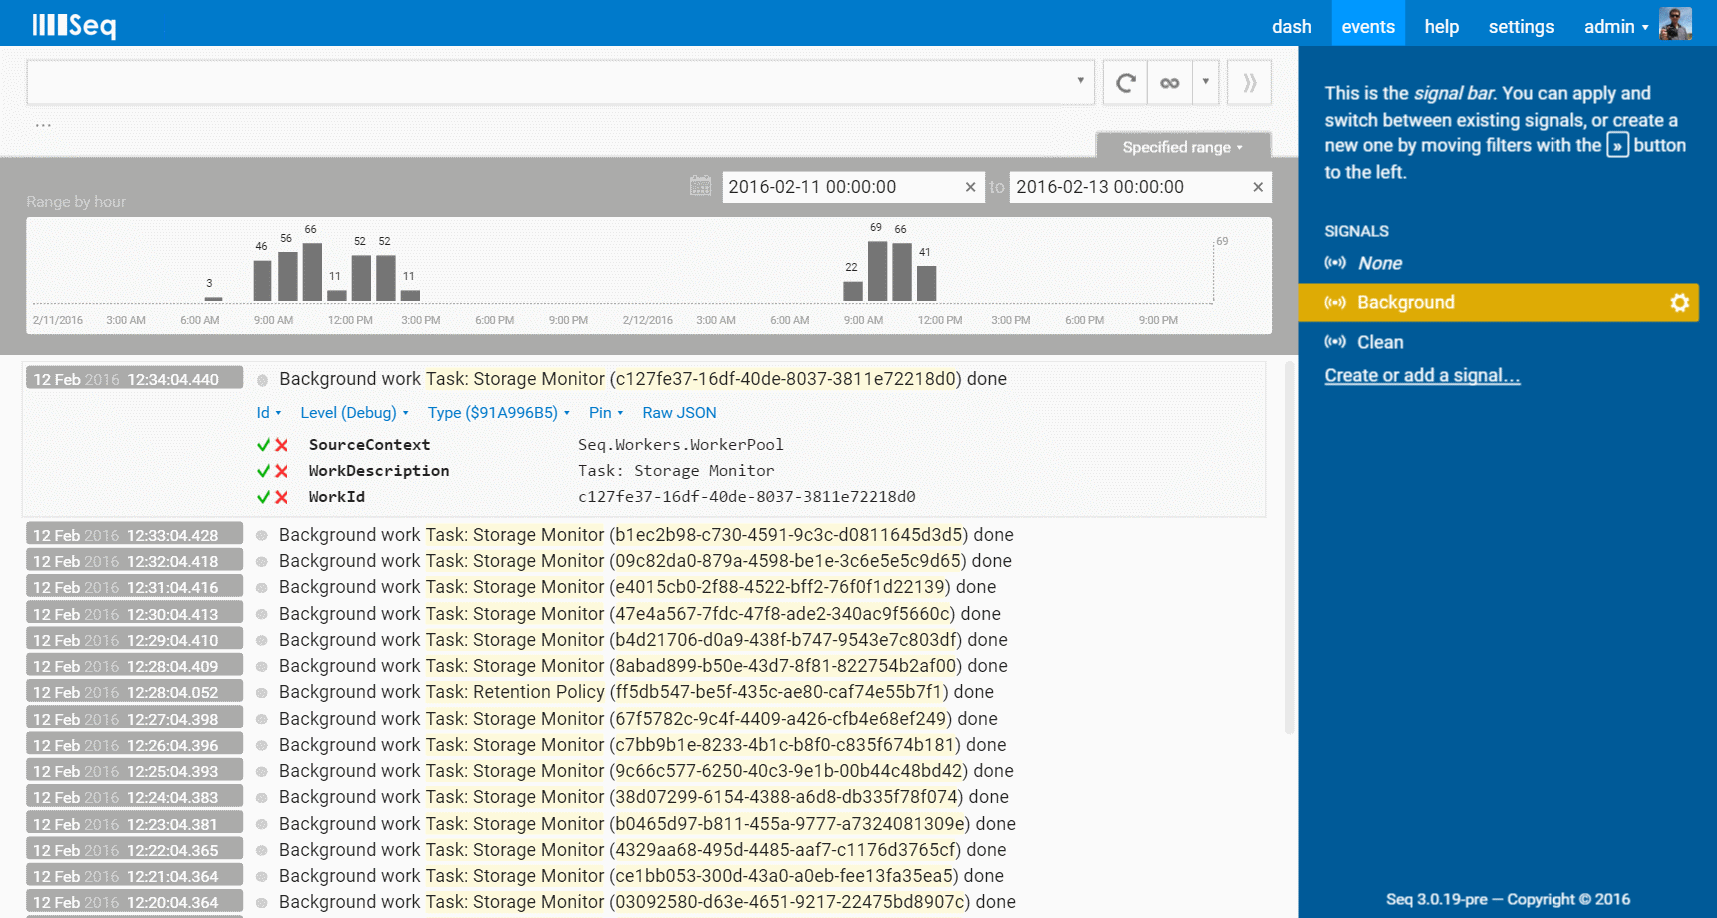
Here is a slice of last week's action, showing some of Seq's internal background tasks completing.
The histogram (a part of Seq 2.0 that's in production today) shows the frequency of events per hour. But, what are the events?
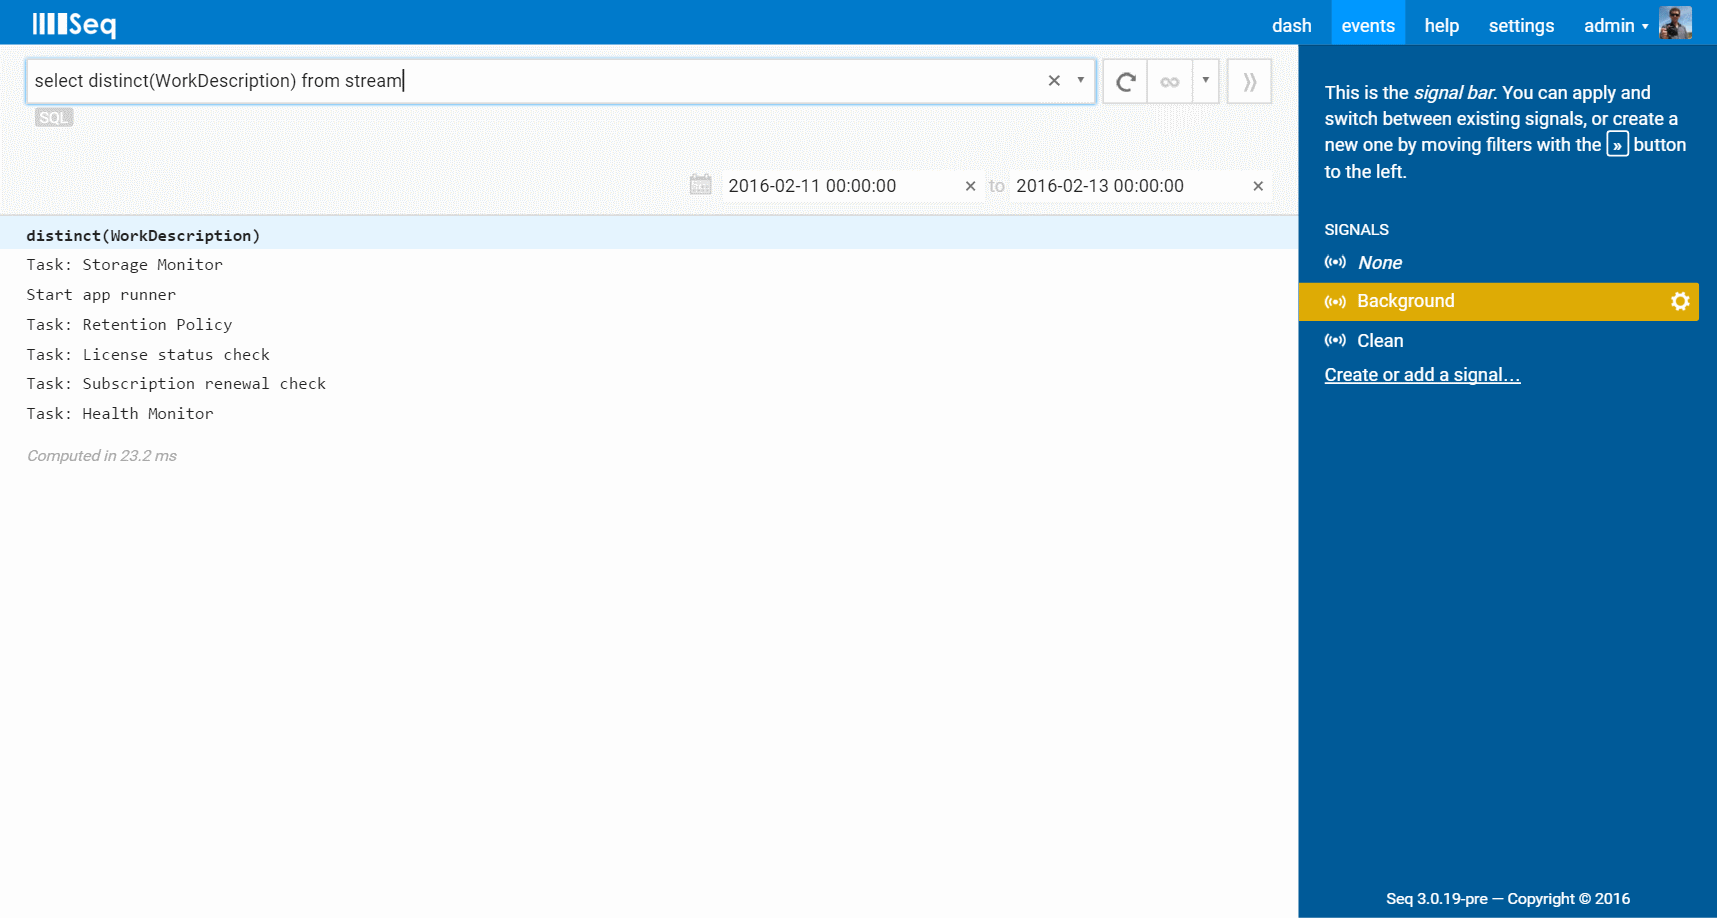
This is super-simple to answer with a distinct query:
select distinct(WorkDescription) from stream
WorkDescription is a property of each event that you can see in the first screenshot. Results are displayed in a table:
(When SQL queries run, a date range of 24 hours is automatically applied, if there isn't one set already.)
This gives the list of distinct work items being run. To get a sense of the distribution of work between different tasks, group by can help:
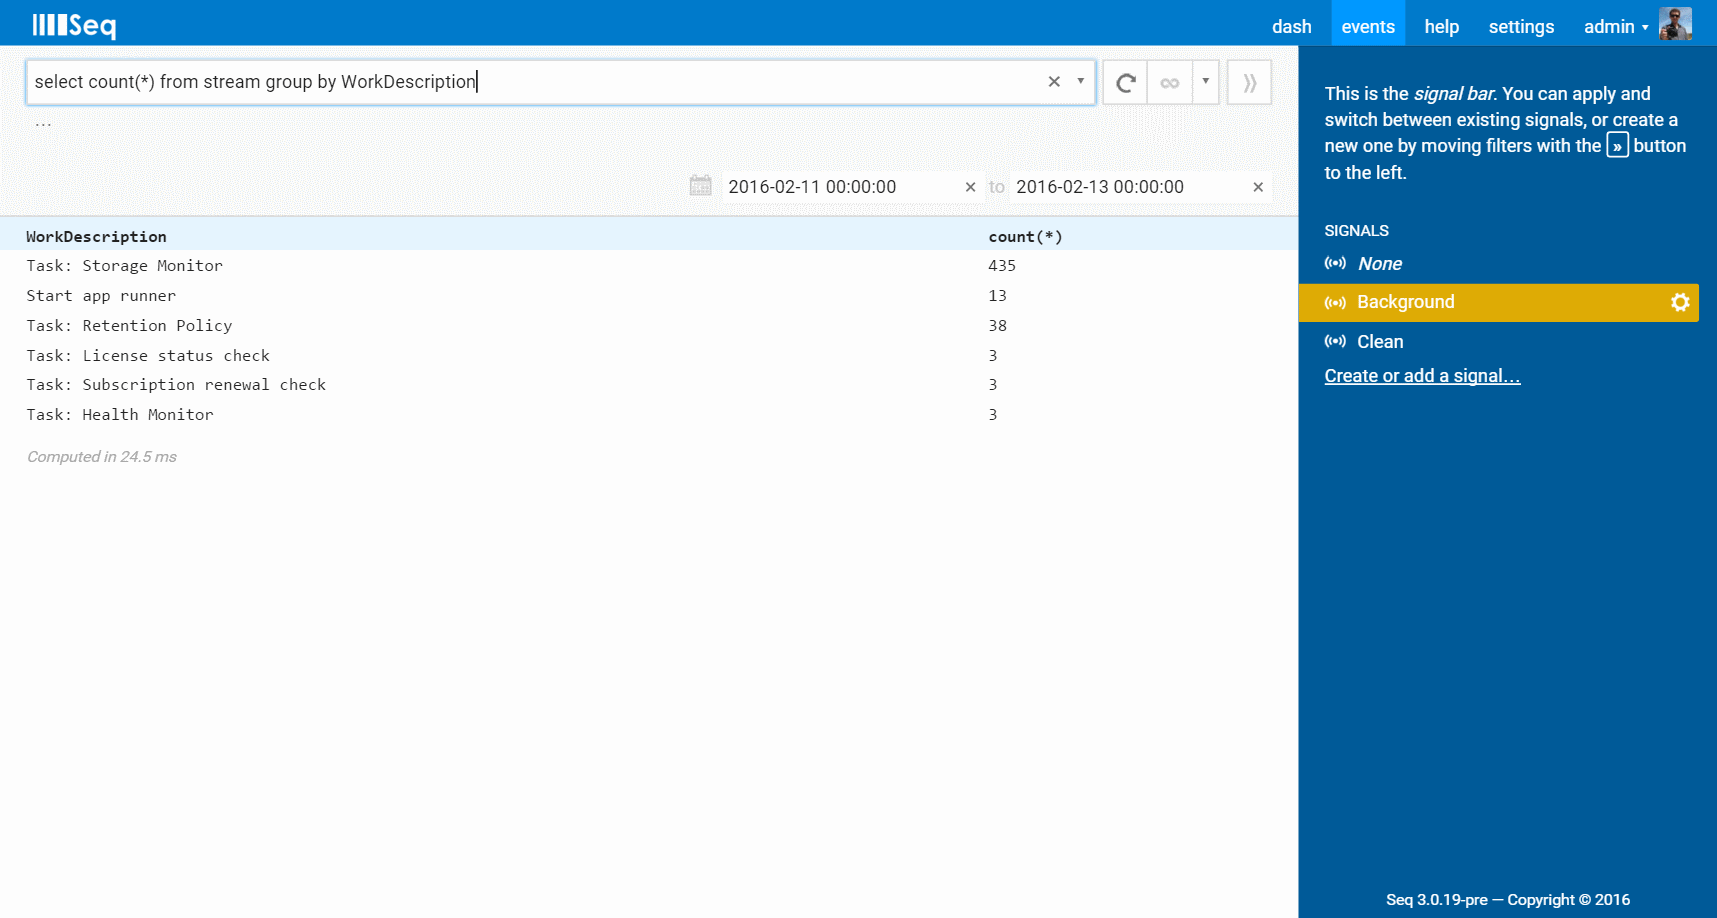
select count(*) from stream group by WorkDescription
This breaks down the count of events per work item type:
Deeper groupings are possible just as with SQL. Notice that in a variation from standard SQL, the grouping columns always appear in the result set - you don't need to specify them in the select column list. (This is one of several places that Seq chooses convenience over full SQL compatibility.)
What about the distribution of work over time? Well, do we have a treat for you!
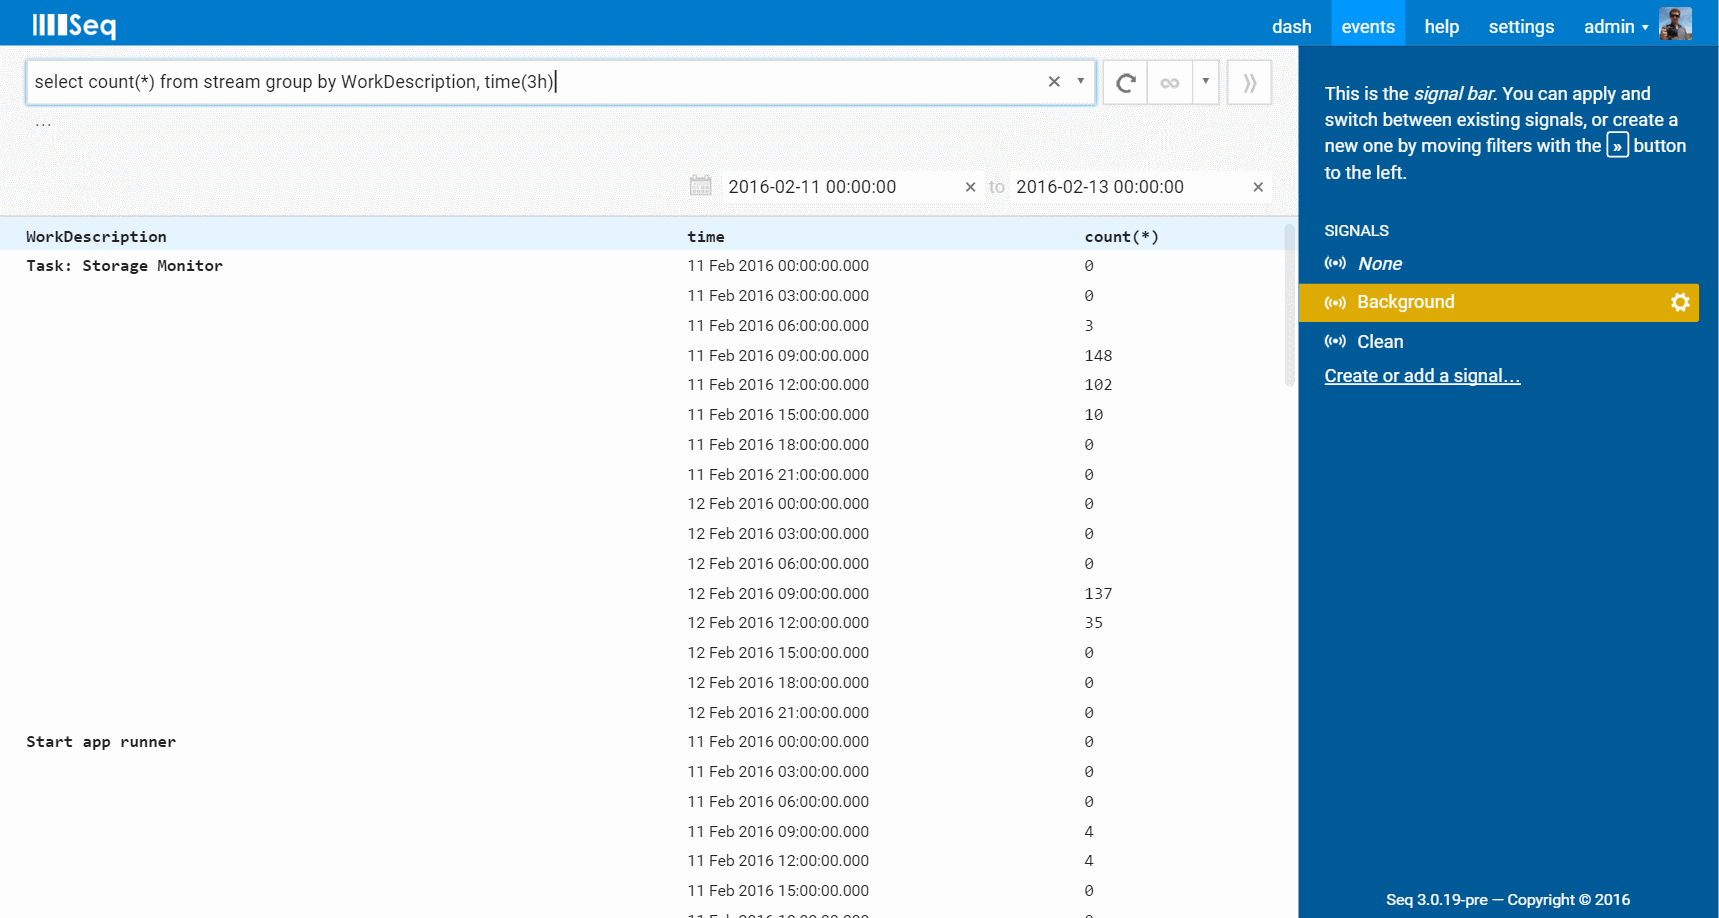
select count(*) from stream group by WorkDescription, time(3h)
Grouping by a time slice expression such as time(3h) will produce a timeseries result:
Durations are specified in seconds (s), minutes (m), hours (h) as above, or days (d). Specify the time dimension last to get a set of timeseries as above, or specify time before the other groupings to get a single series of grouped result sets.
Notice that in each query, from stream has to be specified. SQL queries run against the events being viewed, first applying whatever signals are selected in the right-hand Signal Bar like Background is, here. In the future it might be possible to use from clauses to select signals by name.
More information on SQL syntax and the various aggregate operators is available in the documentation.
Getting the Preview
Seq 3.0.19-pre also includes our first support for Azure Active Directory authentication. More details are coming shortly in a new blog post. For now you can get up to speed using the documentation.
So, what are you waiting for? Grab the new preview build and try it out! You'll find it via the link at the bottom of the download page. Please let us know how how you go, here in the comments or via Twitter.
Happy logging!


