2020.1 Ingestion View
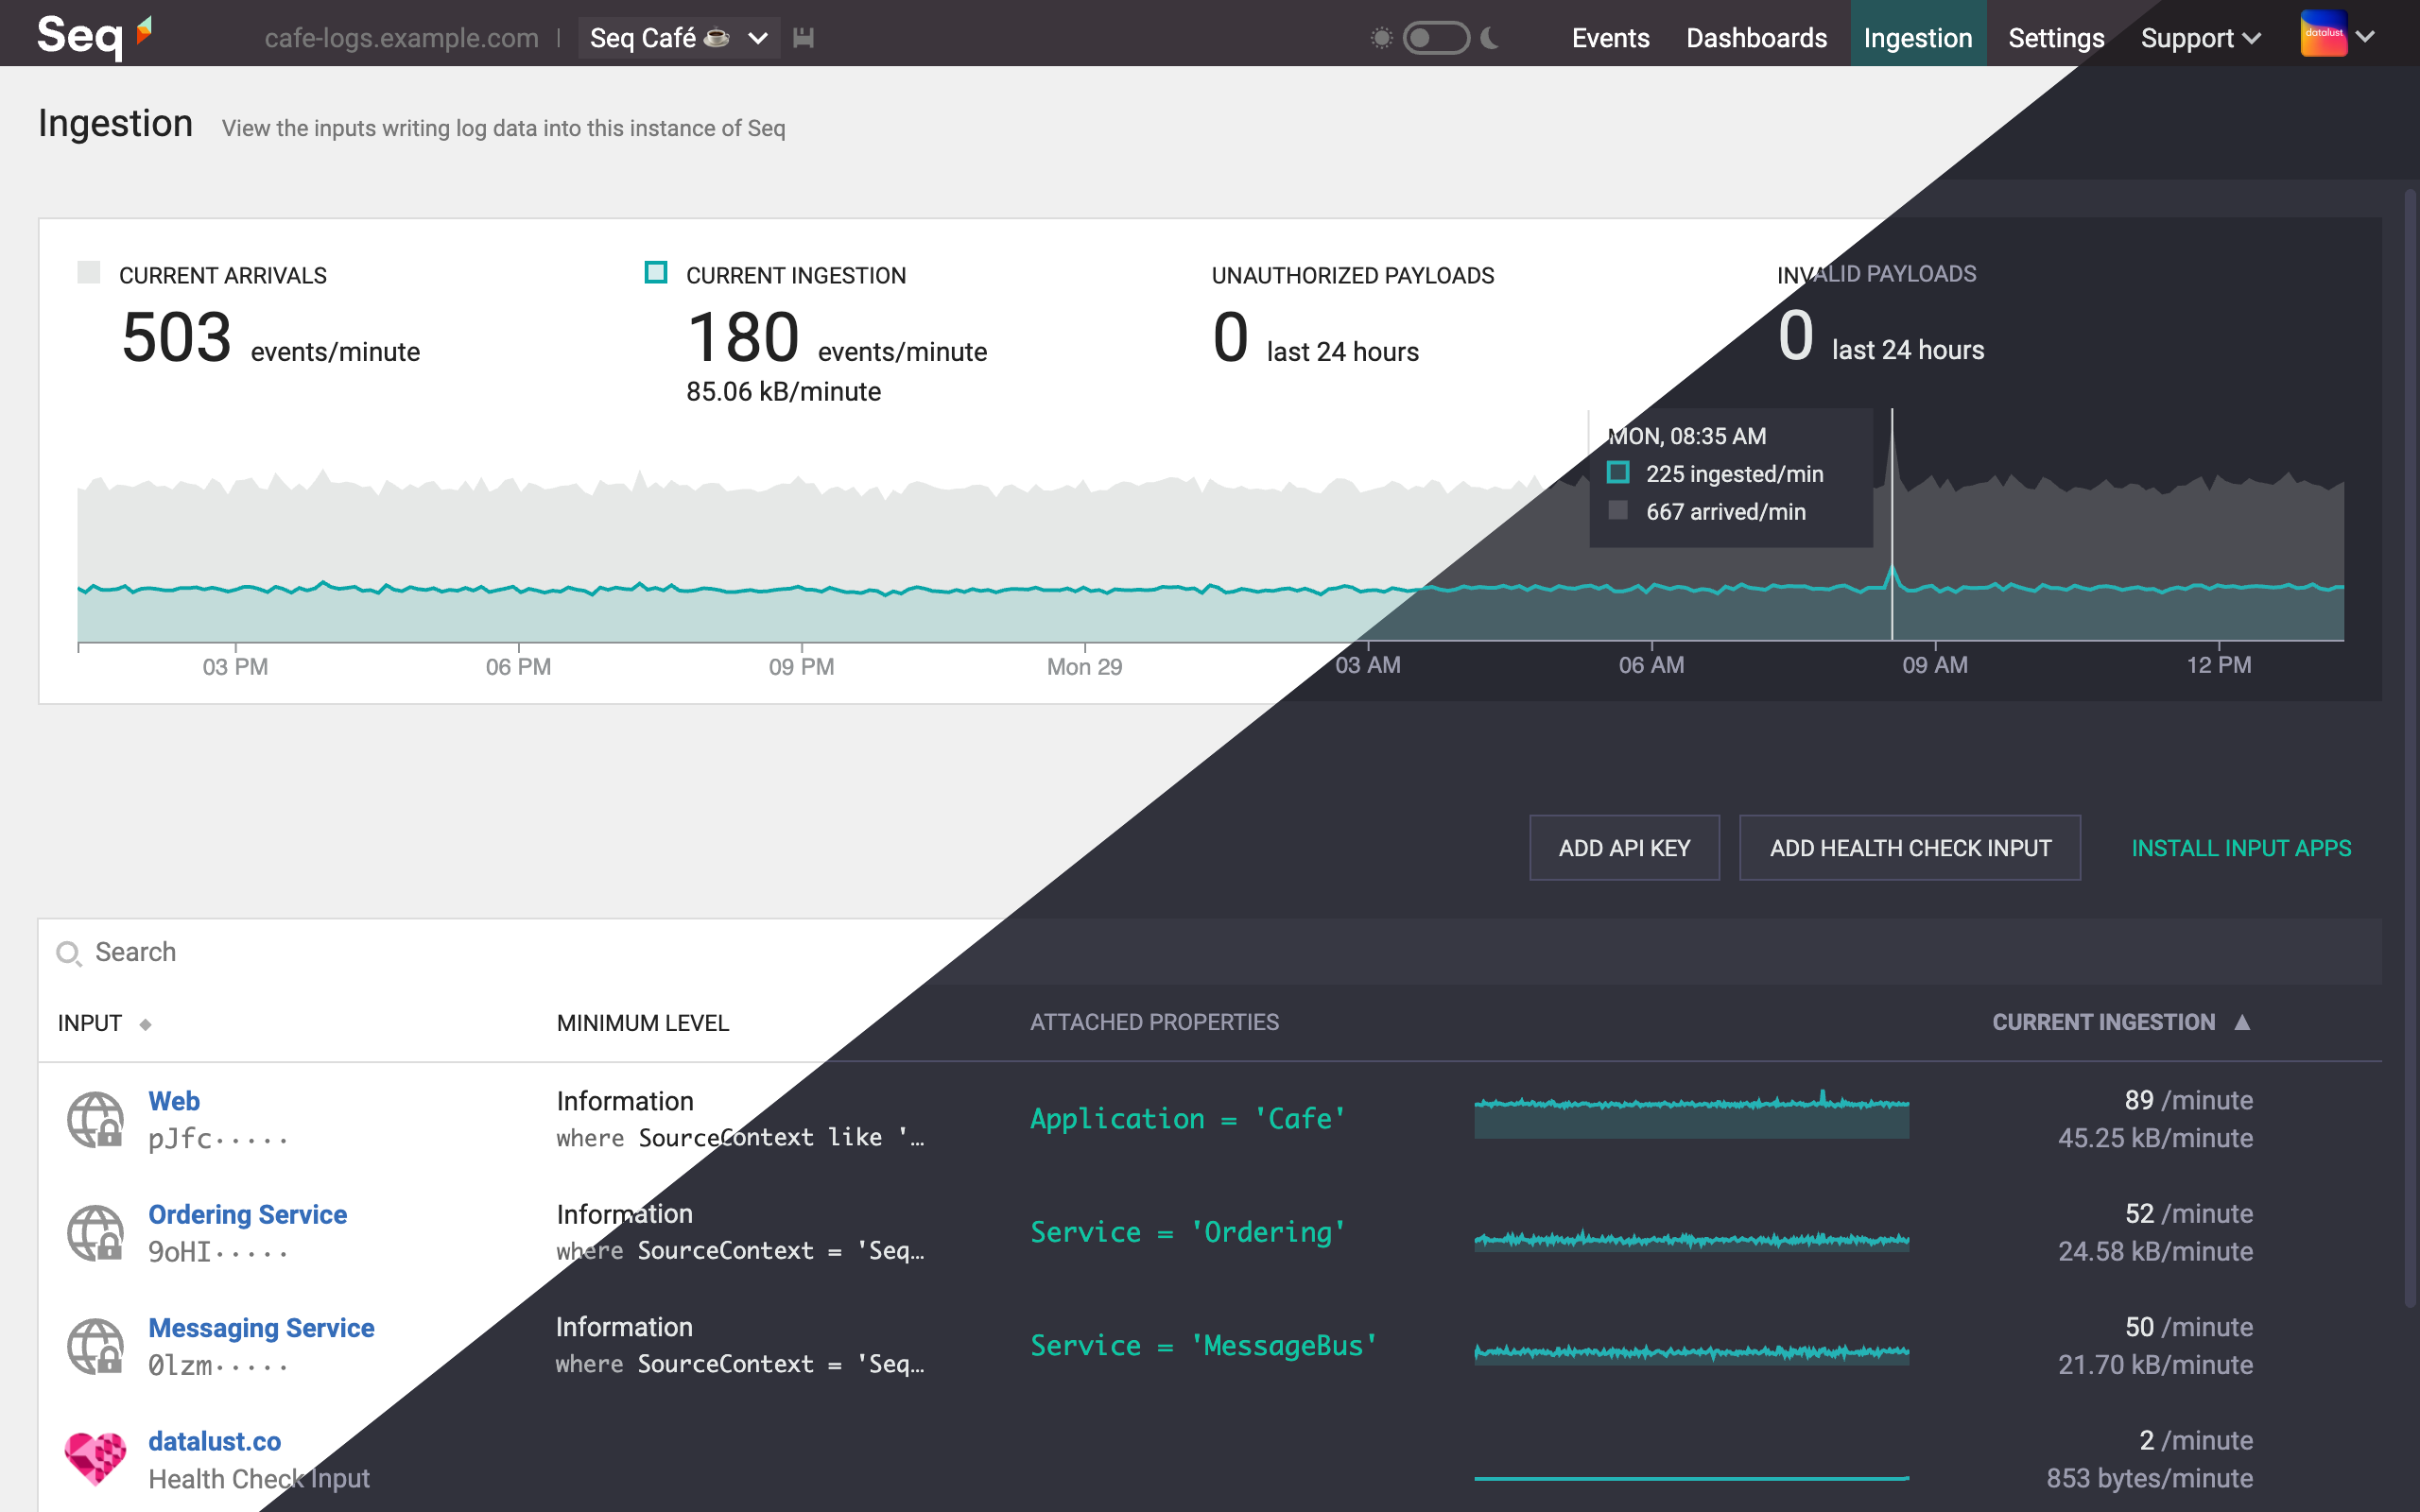
Our brand new Ingestion view is designed to help Seq admins feel in control of their incoming data.
This feature is only available on the newest Seq, download Seq 2020.1 to get started, or docker pull datalust/seq:latest.
Don't miss a thing
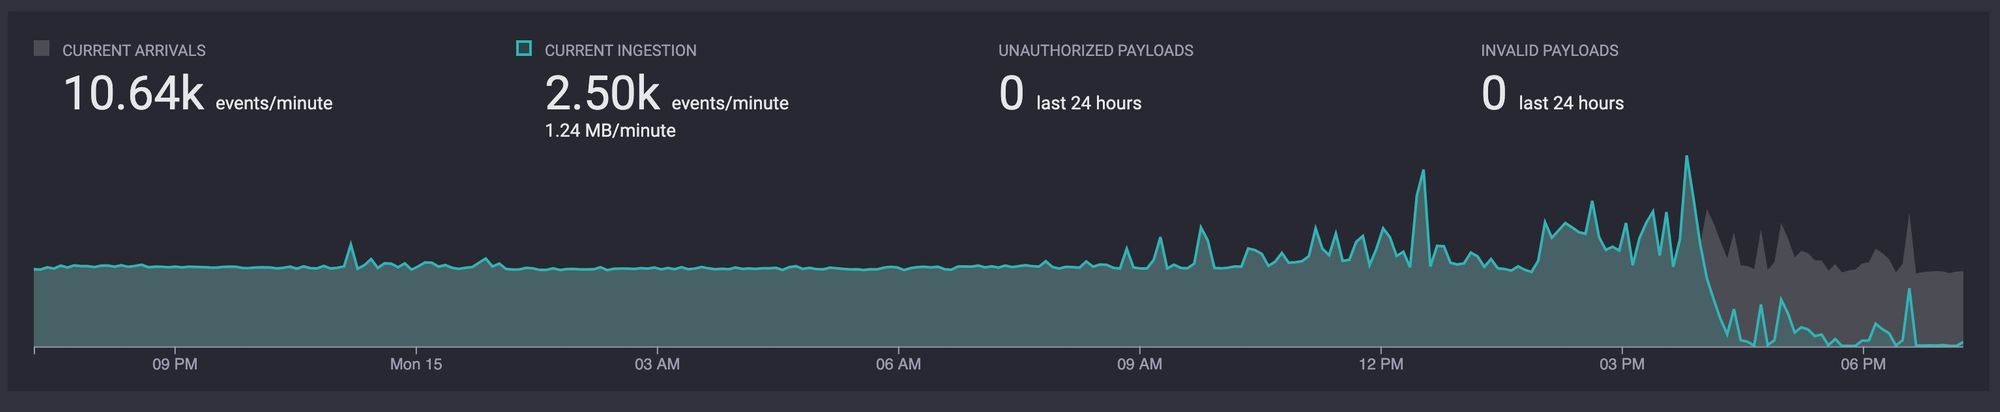
Live statistics of all events arriving and being ingested by Seq are front-and-centre in the Ingestion view, combined with an interactive chart of the last 24 hours of ingestion.
Since its release in the previews, we've had customers discover, through their ingestion statistics, just how noisy their incoming logs are; one customer's system receiving as many as 100 health check events per minute across 10 services, for example.
They were able to use this information to adjust their input filters, cutting down the noise, and adjusting their Seq configuration to only store logs that are important to them. This also helps to increase Seq query performance, as well as save on memory and disk space.
You will also find a count of unauthorized and invalid payloads which have been sent to Seq in the last 24 hours. If you have errors, you can dive into the details by inspecting the ingestion log link that appears, or navigate to <your-seq-url>.com/#/ingestion/log.
Ingestion statistics per input
As an experienced Seq administrator, you might have spent a lot of time in the API Keys screen and the Apps screen to understand how quickly logs were arriving and being ingested by Seq, and from where.
We've moved all of this information into a single searchable table on the Ingestion view, which lists:
- HTTP inputs (API keys configured with "ingest" permissions), and
- input app instances (such as Health Check, Syslog or GELF)
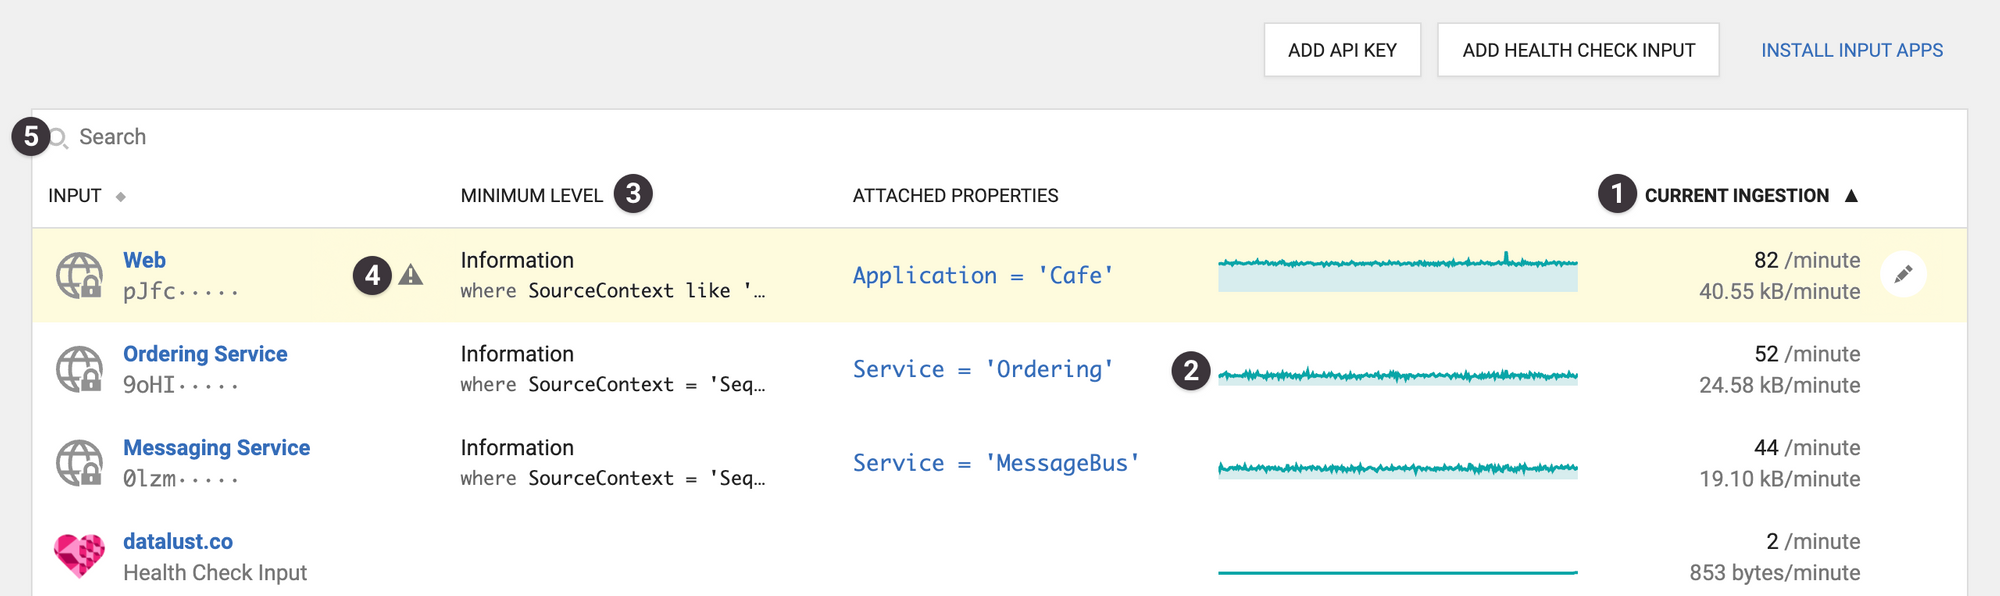
You can use the inputs table to:
- Get a high-level overview of all input sources, sorted by most active (highest ingestion-per-minute) at the top.
- Track ingestion history for last 24 hours for each input.
- Compare minimum levels, custom filters, and attached properties between inputs to see if they're consistent and correct.
- Know which inputs have been hit by invalid payloads, or which app instances have logged diagnostic events, to help with troubleshooting.
- Search/filter by input name, API key prefix, app name, attached properties, minimum level, and so on...
What's next for ingestion?
This is a brand new feature, the biggest in the Seq UI a while, so we'd love to hear your feedback.
If you run into any issues, or bugs, or would like to suggest improvements, please log an issue in the Seq Issue Tracker.
Happy logging! ❤️