Hi! 👋 We've just published Seq 2023.2.9305-pre, the first preview MSI and Docker Hub :preview tag for the upcoming Seq 2023.2.
This preview adds support for log ingestion via the OpenTelemetry protocol (OTLP).
OpenTelemetry is an ambitious suite of protocols, libraries, and related software built around a single data model. Logging is the most recent part of the specification to stabilize, and its purpose is just what you'd expect: cleanly transferring log data from one point to another, with minimal need for log parsers or adapters in between. We hope it succeeds wildly in this role: Seq thrives on good-quality structured log data, and with structured events supported strongly by the OpenTelemetry spec, we think this will make it easier for customers to get better data into Seq, from more sources.
The Seq 2023.2 preview lays down some foundations for OpenTelemetry support, adding:
- A native OpenTelemetry gRPC ingestion endpoint,
- New
@TraceIdand@SpanIdbuilt-ins that unify trace and span information from multiple sources, - The
Traceaction menu, and - A separate
@Resourcenamespace for OpenTelemetry resource attributes.
This post includes enough details to get you started with each of these concepts, and there's more to come as we get closer to a GA release.
Enabling Seq's OTLP/gRPC ingestion endpoint
The OpenTelemetry ingestion endpoint is hosted on the same ports as regular HTTPS ingestion. Because it uses gRPC, OpenTelemetry ingestion is only available on HTTPS endpoints in the current preview.
- When Seq 2023.2 preview is deployed on Docker/Linux, then the usual TLS configuration instructions apply - once Seq is serving HTTPS requests you're good to go.
- On Windows, if you set up a fresh Seq instance with HTTPS using the post-install wizard in the 2023.2 preview MSI, you'll also end up with everything you need: the wizard will check that you have an appropriate certificate in the Local Computer/Personal certificate store, and warn you if none exists.
If you're already running a Seq instance on Windows, after installing the 2023.2 preview MSI there are two additional things to take care of.
First, make sure Seq is serving HTTPS traffic directly, and that a TLS certificate exactly matching the hostname is present under the Local Computer/Personal certificate store:
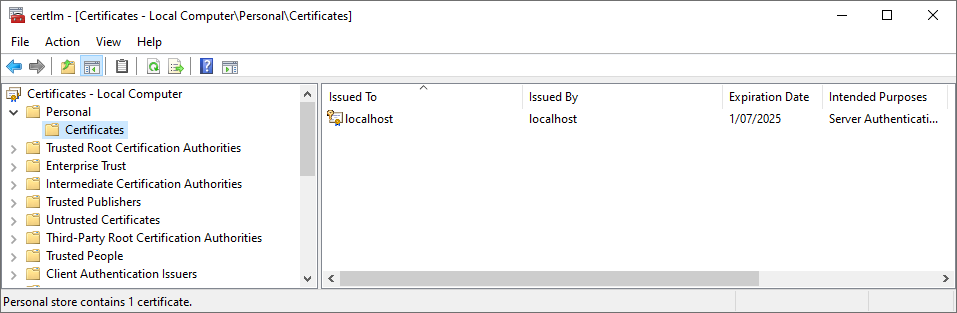
Seq 2023.2 uses the Kestrel web server to support gRPC ingestion, and this ignores the HTTP.sys-based TLS configuration that earlier Seq versions use; instead, Seq looks for a suitable certificate in this store, based on the certificate's subject matching the HTTPS endpoint's hostname.
The Seq service account also needs access to the certificate. If you're running Seq as LocalSystem this will already be the case, but if not, right click on the certificate, select All Tasks, Manage Private Keys..., and add the SeqDefaultInstance service account with full control to the permissions associated with the certificate.
Once you're sure the certificate exists in the right place, has the correct subject name ("Issued To"), and can be used by the Seq service account, switch web servers and restart:
seq config set -k api.webServer -v Kestrel
seq service restart
And that's it! If you can browse to the Seq UI using HTTPS, then you'll be able to send OpenTelemetry logs to the same endpoint, using any OpenTelemetry Logs source.
Configuring Microsoft.Extensions.Logging with OpenTelemetry and Seq
ASP.NET Core and other .NET applications that use Microsoft.Extensions.Logging without Serilog can use the OpenTelemetry.Exporter.OpenTelemetryProtocol.Logs NuGet package to send data.
First, some minimal package references:
dotnet add package OpenTelemetry.Exporter.OpenTelemetryProtocol.Logs --prerelease
dotnet add package OpenTelemetry.Instrumentation.AspNetCore --prerelease
Then, in Program.cs you'll need to hook into the AddLogging() method and add an OTLP exporter:
var builder = WebApplication.CreateBuilder(args);

// Other configuration ...

builder.Services.AddLogging(logging => logging.AddOpenTelemetry(openTelemetryLoggerOptions =>
{
    openTelemetryLoggerOptions.SetResourceBuilder(
        ResourceBuilder.CreateEmpty()
            .AddService("GettingStarted")
            .AddAttributes(new Dictionary<string, object>
            {
                ["deployment.environment"] = "development"
            }));

    openTelemetryLoggerOptions.IncludeScopes = true;
    openTelemetryLoggerOptions.IncludeFormattedMessage = true;

    openTelemetryLoggerOptions.AddOtlpExporter(exporter =>
    {
        // This must be an HTTPS URI; gRPC will be used.
        exporter.Endpoint = new Uri("https://localhost:45341");
    });
}));

var app = builder.Build();
The IncludeScopes option ensures properties attached through ILogger.BeginScope() get transmitted to Seq. The IncludeFormattedMessage option ensures Seq can reliably identify the original message template that produced the event - it's possible there will be some change in this area down the track.
If everything is configured correctly, launching your application will cause some logs to show up in the Seq Events screen:
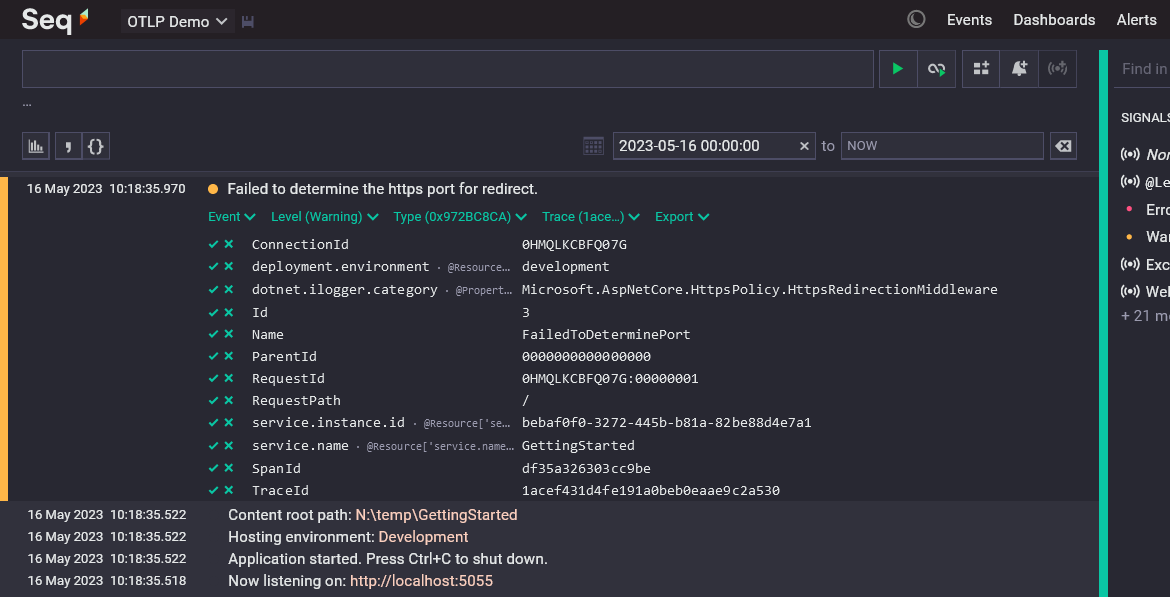
The .NET OTLP exporter includes quite a few interesting properties, including the environment and service name we configured, some contextual information from the web request, and various other details (including duplicate copies of TraceId and SpanId, which Seq also collects from the OTLP message envelope and exposes through @TraceId and @SpanId - expect some changes here, too).
Configuring Serilog with Serilog.Sinks.OpenTelemetry and Seq
If you're using Serilog to instrument your .NET applications, then it's more than likely you'll use Serilog.Sinks.Seq in production today, but you can also explore the world of OpenTelemetry using Serilog.Sinks.OpenTelemetry, which is an independent implementation of the OpenTelemetry Logs protocol from the Serilog project, now approaching its 1.0 release.
dotnet add package Serilog.Sinks.OpenTelemetry
Configuration is simple:
Log.Logger = new LoggerConfiguration()
    .Enrich.FromLogContext()
    .WriteTo.OpenTelemetry(options =>
    {
        options.Endpoint = "https://localhost:45341";
        options.ResourceAttributes["service.name"] = "GettingStarted";
        options.ResourceAttributes["deployment.environment"] = "development";
    })
    .CreateLogger();
The resulting events in Seq look very similar to what's pictured in the ASP.NET Core sample above.
Trace and span built-ins
OpenTelemtry treats trace and span ids as first-class log event properties, in much the same way that Seq gives special treatment to messages, timestamps, and levels today.
Seq 2023.2 adds two new built-in properties, @TraceId and @SpanId, which it populates from OTLP log data. Using first-class built-in properties, instead of payload properties like TraceId and SpanId, means that trace and span information can be referred to consistently regardless of the data source. It would be much harder for Seq to "light up" tracing-related features in the future if some log sources used trace_id, others traceId, and so-on.
You can refer to the new properties in queries as you'd expect, for example, to find all events in the same trace:
@TraceId = '1048316e6eee0e15ab3564c863180f88'
But, these built-ins don't appear in the expanded event property list. Instead, Seq 2023.2 preview shows a new drop-down menu Trace just above the property list, and its there you can find the trace and span-related filtering actions.
Resource properties
You'll notice in the screenshot up above that service.name, deployment.environment, and a few other properties appear with an inlay hint @Resource... beside them. These properties belong to the resource namespace, and are accessed in Seq queries through the @Resource object, so that their names don't collide with those attached directly to log events.
Resource attributes describe the origin of events in OpenTelemetry. They're otherwise just normal log data, from Seq's point of view.
What about traces and metrics?
We're exploring how OTLP traces and metrics fit into Seq's future, but right now our goal is to bring Seq's low-friction setup and great log analysis experience to developers targeting OpenTelemetry.
Structured logs are powerful enough to capture a lot of what traces and metrics both provide - Seq already has great correlation support, and can perform sophisticated metric aggregation on raw log data, so you may not necessarily miss direct tracing or metrics support if you're already collecting structured logs with Seq.
Seq works well alongside dedicated tracing and metrics providers today, though, if you want these.
We'd love to hear your feedback
This is very much the beginning of our OpenTelemetry journey. We're interested in all kinds of feedback - your questions, what works well for you, and what doesn't. You can reach the Seq development team here, through our public GitHub Discussions board, our email support address, or by pinging @nblumhardt on the CNCF Slack.
Here's the 👉 preview Windows MSI and datalust/seq:preview image. Check back in a week or so for our next update 😎