Nested somewhere under C:\inetpub\logs, IIS, the popular Windows web server, writes files like this:
#Software: Microsoft Internet Information Services 10.0
#Version: 1.0
#Date: 2019-04-02 05:17:47
#Fields: date time s-ip cs-method cs-uri-stem cs-uri-query s-port cs-username c-ip cs(User-Agent) cs(Referer) sc-status sc-substatus sc-win32-status time-taken
2019-04-02 05:17:47 ::1 GET / - 80 - ::1 Mozilla/5.0+(Windows+NT+10.0;+Win64;+x64;+rv:66.0)+Gecko/20100101+Firefox/66.0 - 200 0 0 183
2019-04-02 05:18:01 ::1 GET /test - 80 - ::1 Mozilla/5.0+(Windows+NT+10.0;+Win64;+x64;+rv:66.0)+Gecko/20100101+Firefox/66.0 - 404 0 2 0
This format is standardized by the W3C. It's not the prettiest thing I've ever seen 😬, but, it does lend itself to easy processing: the (non-comment) lines are space-delimited fields; whitespace isn't allowed within values (quoted strings are discussed in the spec, but not used by IIS), and empty fields are represented by a single dash -.
Here is one significant line from the log, wrapped so that it fits within the margins of this blog:
2019-04-02 05:18:01 ::1 GET /test - 80 - ::1 Mozilla/5.0+(Windows+NT+10.0;+Win64;+x64;+rv:66.0)+Gecko/20100101+Firefox/66.0 - 404 0 2 0
This was a request for http://localhost/test. Among the fields, you'll find the port 80, HTTP method GET and path /test, the user agent (Firefox), the response status code 404, and a zero-millisecond timing. All information we can use to find patterns, explore trends, and check the health of a web application.
Before we import this log into Seq for analysis, we want to break the line up into structured data and give the fields names like RequestPath and Elapsed so that the log is easy to search and graph.
Something like:
So, armed with seqcli, here we go!
1. Get seqcli
If you have Windows build of Seq 5.1 installed locally, you'll already have seqcli on your PATH. Otherwise, download the .zip or .tar.gz archive for your platform, from the project's GitHub releases.
Run seqcli config to set the default server URL and API key (the default will be to connect to http://localhost:5341).
seqcli config -k connection.serverUrl -v https://seq.example.com
seqcli config -k connection.apiKey -v 1234567890asdfghjkl
You can check your connection to Seq with:
seqcli search
And the result should be the last event recorded in Seq.
2. {Bracket} the fields
To extract individual fields, we'll need an extraction pattern, which is a bit like a regular expression for matching different chunks of the line.
The extraction pattern isn't all that different from the field list that appears at the top of the log file, so, we'll use that as a starting point and work step-by-step. This approach will work even if your own IIS instance is configured to record a different set of fields.
The first step is to {} bracket the individual fields.
Given the field list:
date time s-ip cs-method cs-uri-stem cs-uri-query s-port cs-username c-ip cs(User-Agent) cs(Referer) sc-status sc-substatus sc-win32-status time-taken
We add some brackets:
{date time} {s-ip} {cs-method} {cs-uri-stem} {cs-uri-query} {s-port} {cs-username} {c-ip} {cs(User-Agent)} {cs(Referer)} {sc-status} {sc-substatus} {sc-win32-status} {time-taken}
The text outside the brackets - here just spaces - will be matched literally. Each bracketed chunk will match a token with any non-whitespace content.
3. Names and types
This isn't a valid extraction pattern, yet.
First, we'll treat the two fields date and time as the event's timestamp @t. Slurping up the space in between them requires the special-purpose w3cdt matcher:
{@t:w3cdt} {s-ip} {cs-method} {cs-uri-stem} {cs-uri-query} {s-port} {cs-username} {c-ip} {cs(User-Agent)} {cs(Referer)} {sc-status} {sc-substatus} {sc-win32-status} {time-taken}
Second, the fields need identifiers without dashes, so we'll make up some PascalCase names:
{@t:w3cdt} {ServerIP} {RequestMethod} {RequestPath} {Query} {ServerPort} {Username} {ClientIP} {UserAgent} {Referer} {StatusCode} {Substatus} {Win32Status} {Elapsed}
Some of these fields will contain numeric data, so we'd like to treat them as numbers instead of text. Just like w3cdt, we can use matchers to convert the values. The nat matcher picks up natural (non-negative) numbers:
{@t:w3cdt} {ServerIP} {RequestMethod} {RequestPath} {Query} {ServerPort:nat} {Username} {ClientIP} {UserAgent} {Referer} {StatusCode:nat} {Substatus:nat} {Win32Status:nat} {Elapsed:nat}
4. Match the newline
Finally, each event is delimited by a closing newline, so for completeness we'll add an anonymous n newline matcher at the end:
{@t:w3cdt} {ServerIP} {RequestMethod} {RequestPath} {Query} {ServerPort:nat} {Username} {ClientIP} {UserAgent} {Referer} {StatusCode:nat} {Substatus:nat} {Win32Status:nat} {Elapsed:nat}{:n}
Done!
5. Ingest
This is the easy bit; here's the command-line, where you can see our extraction pattern being passed through:
seqcli ingest `
  -i u_ex190402.log `
  --invalid-data=ignore `
  -x "{@t:w3cdt} {ServerIP} {RequestMethod} {RequestPath} {Query} {ServerPort:nat} {Username} {ClientIP} {UserAgent} {Referer} {StatusCode:nat} {Substatus:nat} {Win32Status:nat} {Elapsed:nat}{:n}" `
  -m "IIS {RequestMethod} {RequestPath} responded {StatusCode} in {Elapsed} ms"
First, with -i we pass the log file to ingest.
The second argument, --invalid-data=ignore, lets us skip over those leading # comment lines.
With -x we pass through the extraction pattern that describes how fields from the log lines map to event properties.
Finally, -m specifies a friendly message template that Seq will display in the events view.
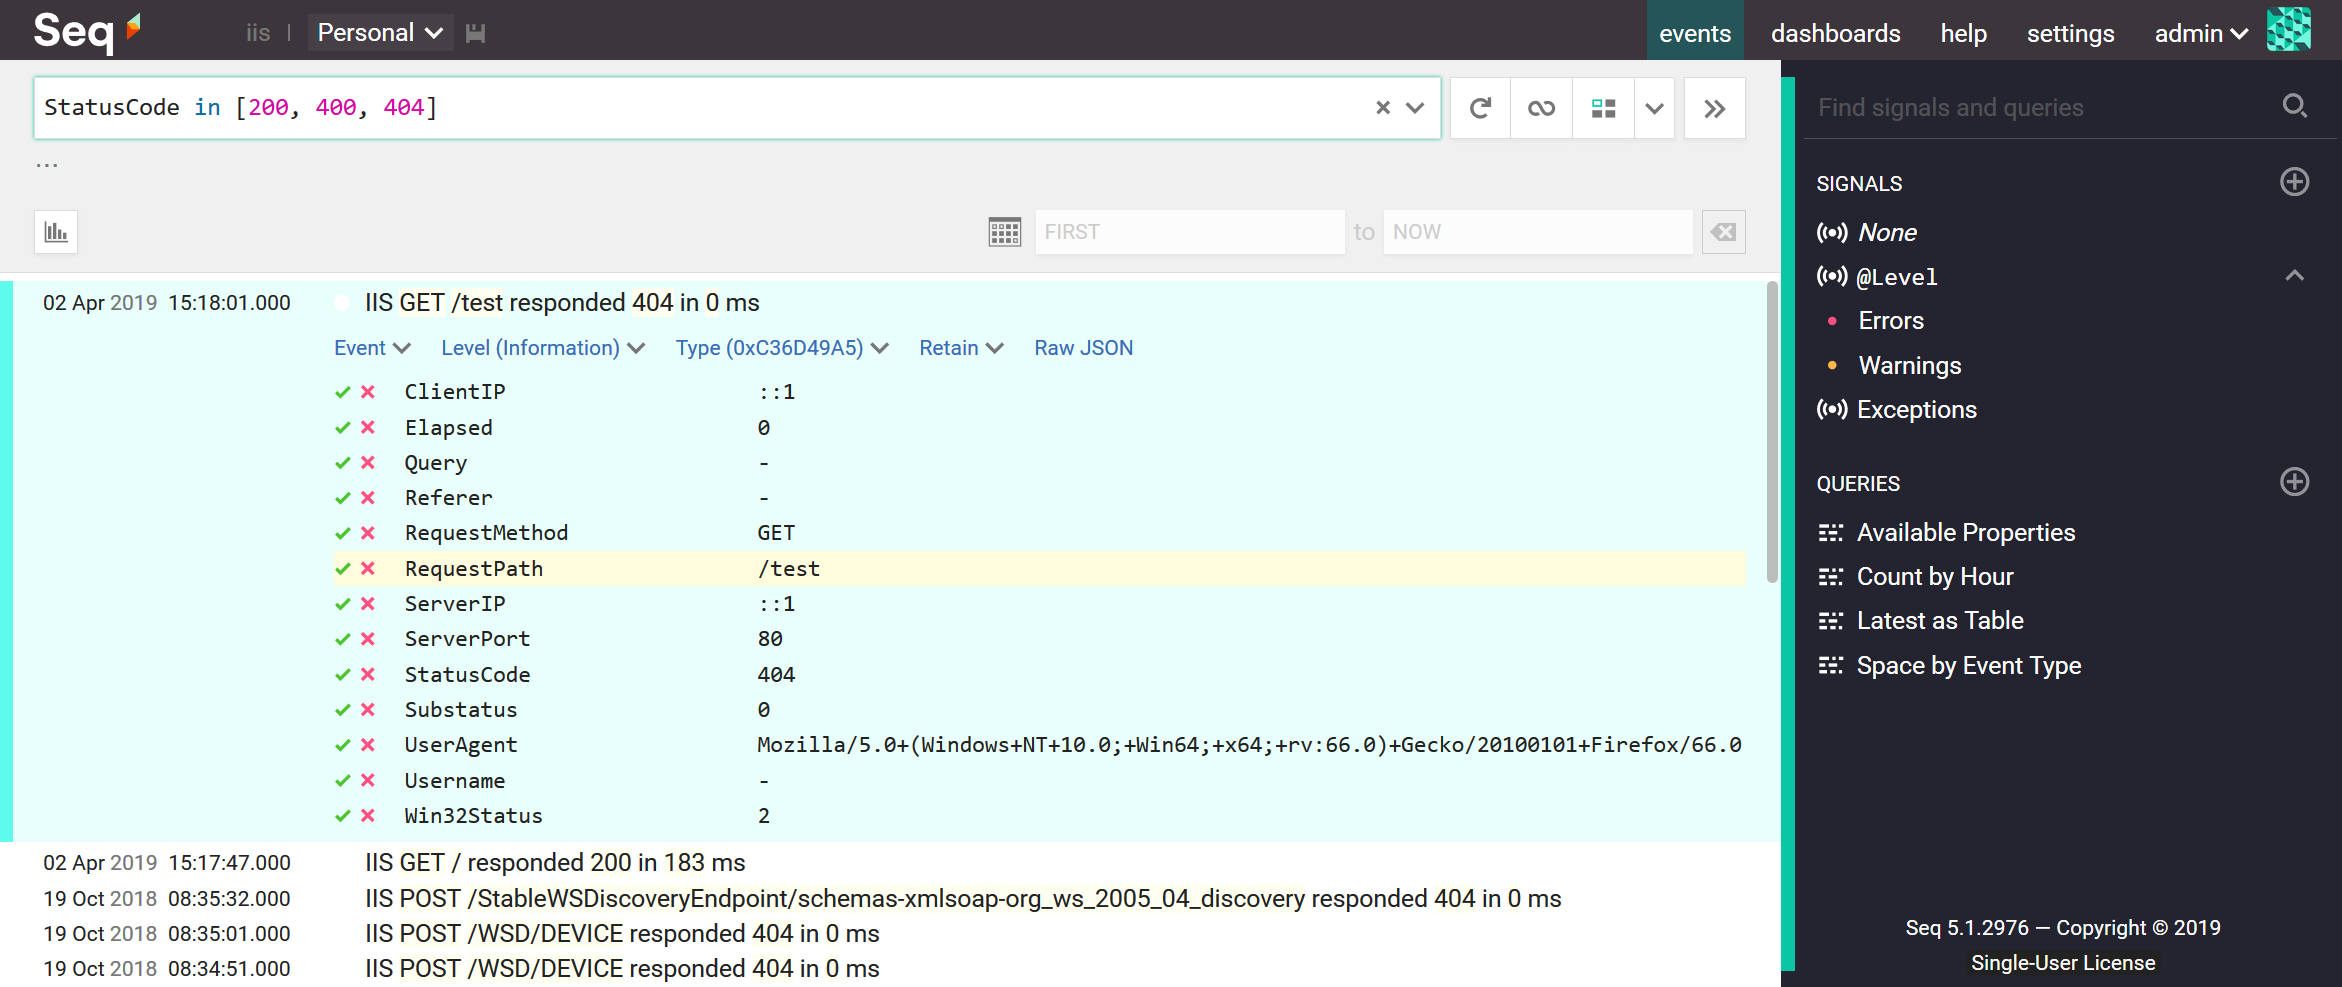
After running this command, refreshing the Seq events screen shows the requests from the log file.
6. Analyze
What can you find in the data? Here are some Seq filters and queries to try.
Find 404s:
StatusCode = 404
Count requests by path:
select count(*) from stream group by RequestPath
Track response times for a specific request:
select percentile(Elapsed, 90) as p90th
where RequestPath = '/test'
  and Method = 'GET'
group by StatusCode, time(5m)
(Click the 📈 timeseries chart icon to plot this.)
There are endless ways to slice and dice the data; check out the Seq query language documentation for some more ideas.
Happy logging!